Product Design · 2019 · Shipped
Cisco / AppDynamics
A push notification that says whether to get out of bed.
When AppDynamics paged an on-call engineer, the push said a problem was detected and nothing about how bad it was. I designed the alerting experience of the rebuilt mobile app on iOS and Android, as one part of a ground-up rebuild of the app: the notification, the feed, the detail, the rules and sharing. A 168-person survey from the UX research team and twelve interviews I ran pointed at the notification, and a three-way concept test picked metric values over a chart or end-user impact. It shipped, and the push now gives the error rate, its threshold and how often it has fired, so you can decide whether to get up.
- Role
- Product Designer
- Year
- 2019
- Platform
- iOS and Android
- Status
- Shipped
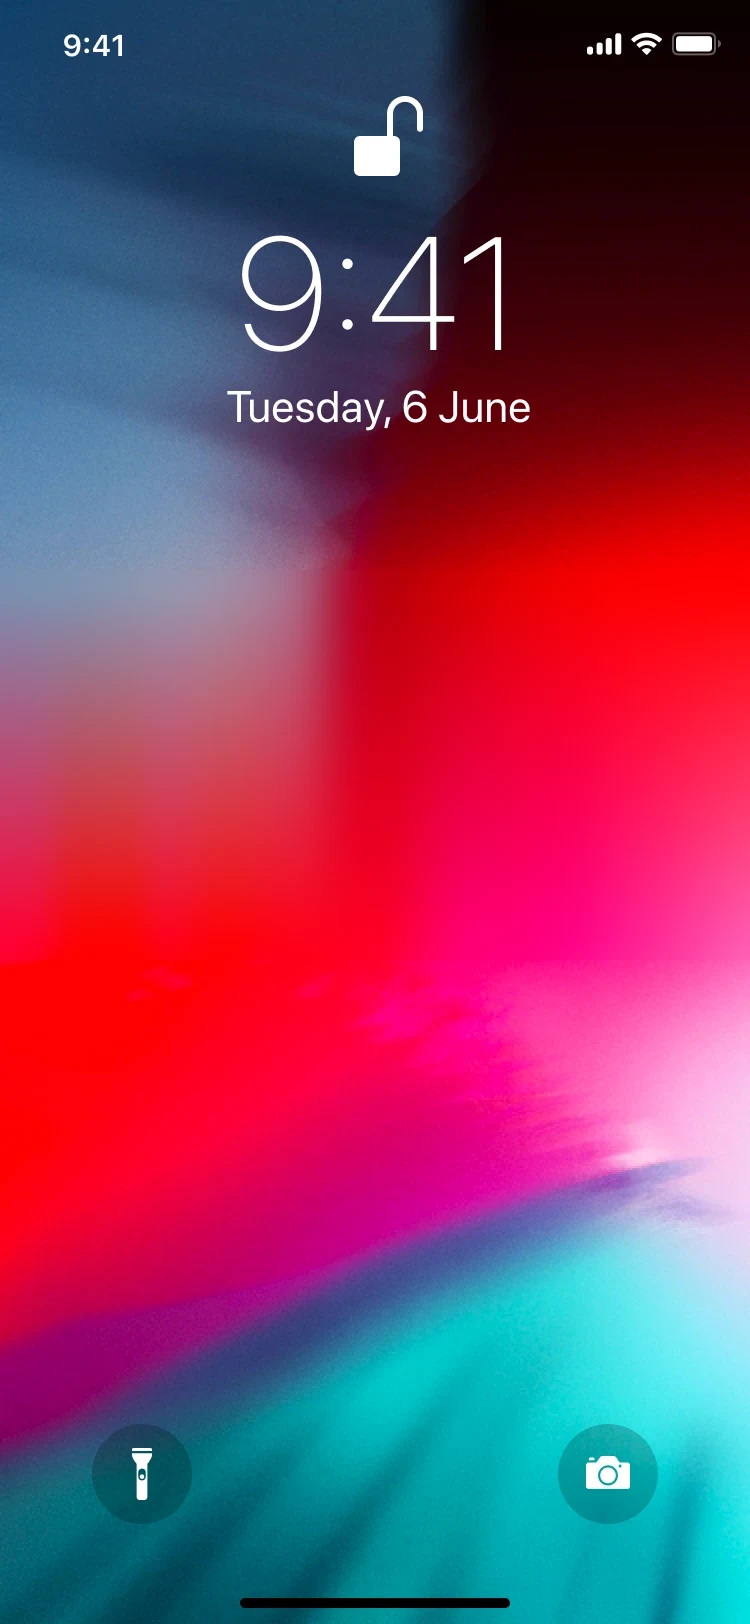
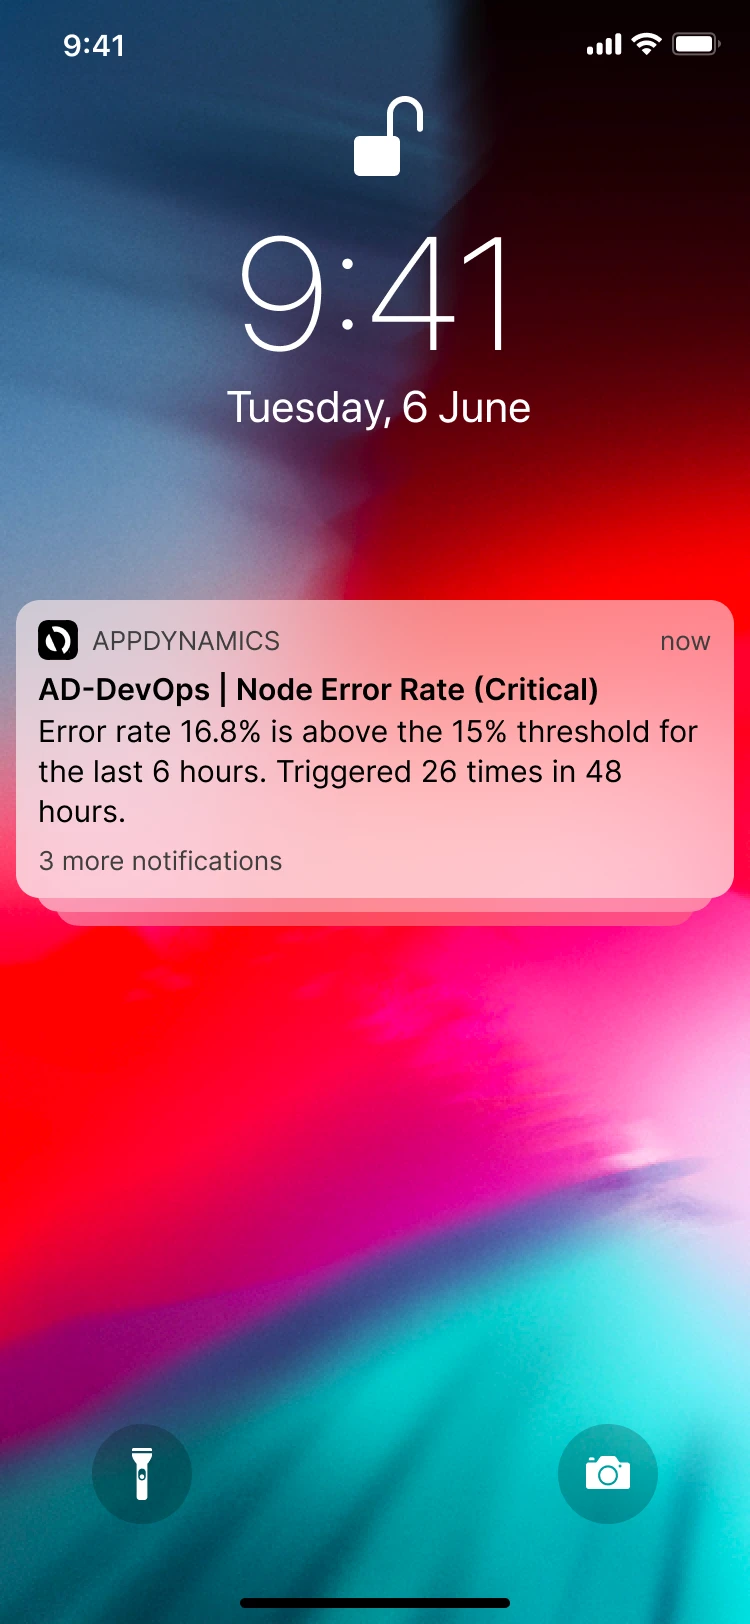
 APPDYNAMICSnow
AD-DevOps | Node Error Rate (Critical)
Error rate 16.8% is above the 15% threshold for the last 6 hours. Triggered 26 times in 48 hours.
3 more notifications
APPDYNAMICSnow
AD-DevOps | Node Error Rate (Critical)
Error rate 16.8% is above the 15% threshold for the last 6 hours. Triggered 26 times in 48 hours.
Problem
A push told an on-call engineer that something was wrong, and nothing about how wrong.
Approach
Put the violated condition and its value in the notification, then carry the same answer through the feed, the detail and the rules.
Result
Shipped inside the rebuilt AppDynamics mobile app. The notification now says whether to get up.
01 · Problem
Paged at 3am, and the notification said nothing.
Before, a push said a problem was detected. After, it gives the error rate, its threshold and the count.
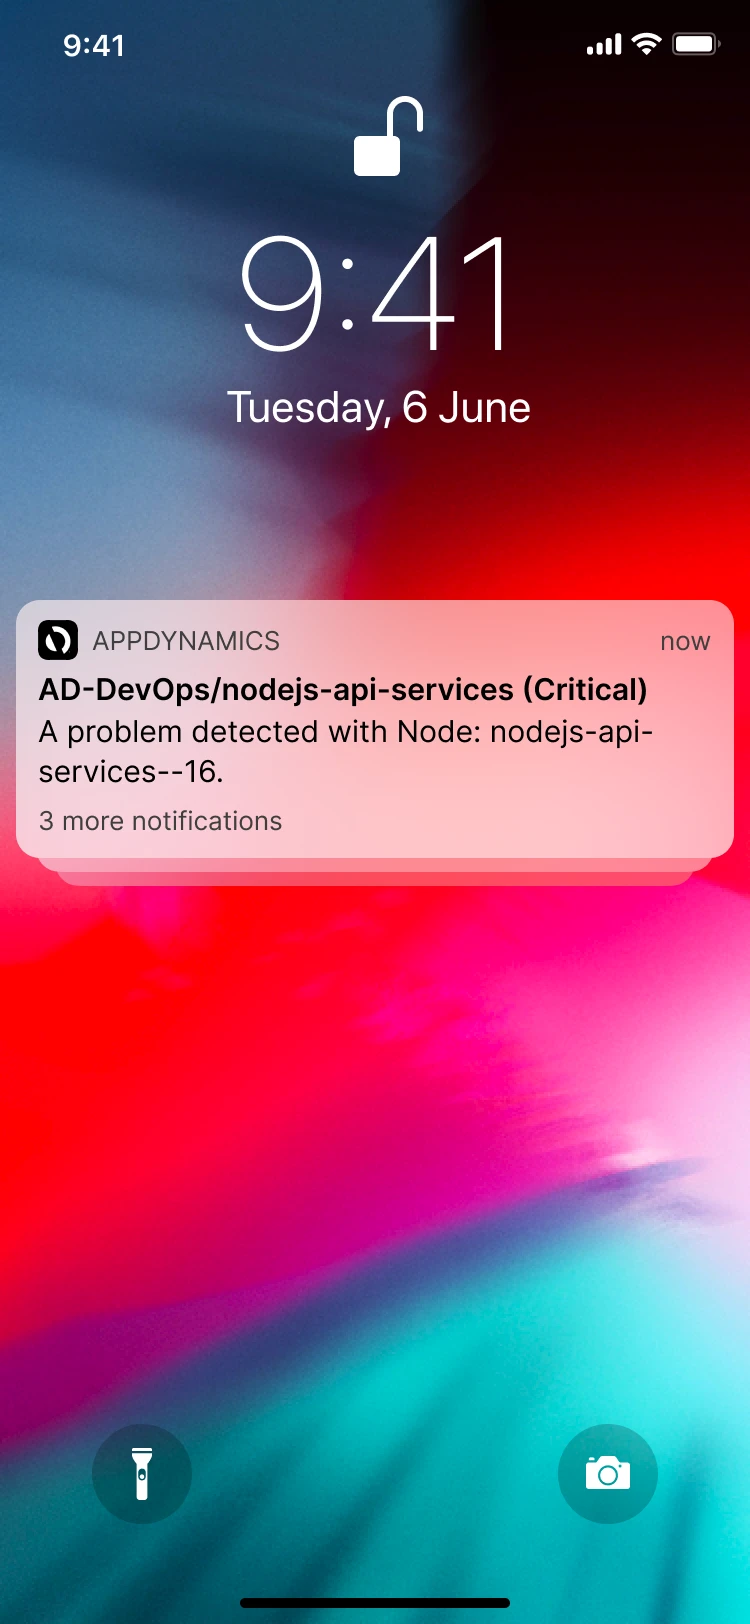
AppDynamics monitors application performance for enterprise teams. When a health rule breaks, whoever is on call gets a push.
I designed the notification, the feed, the detail screens, the rules and sharing, on iOS and Android.
02 · Constraint: Android
Most of them were on Android.
The same alert and the same numbers, in Android's system notification.
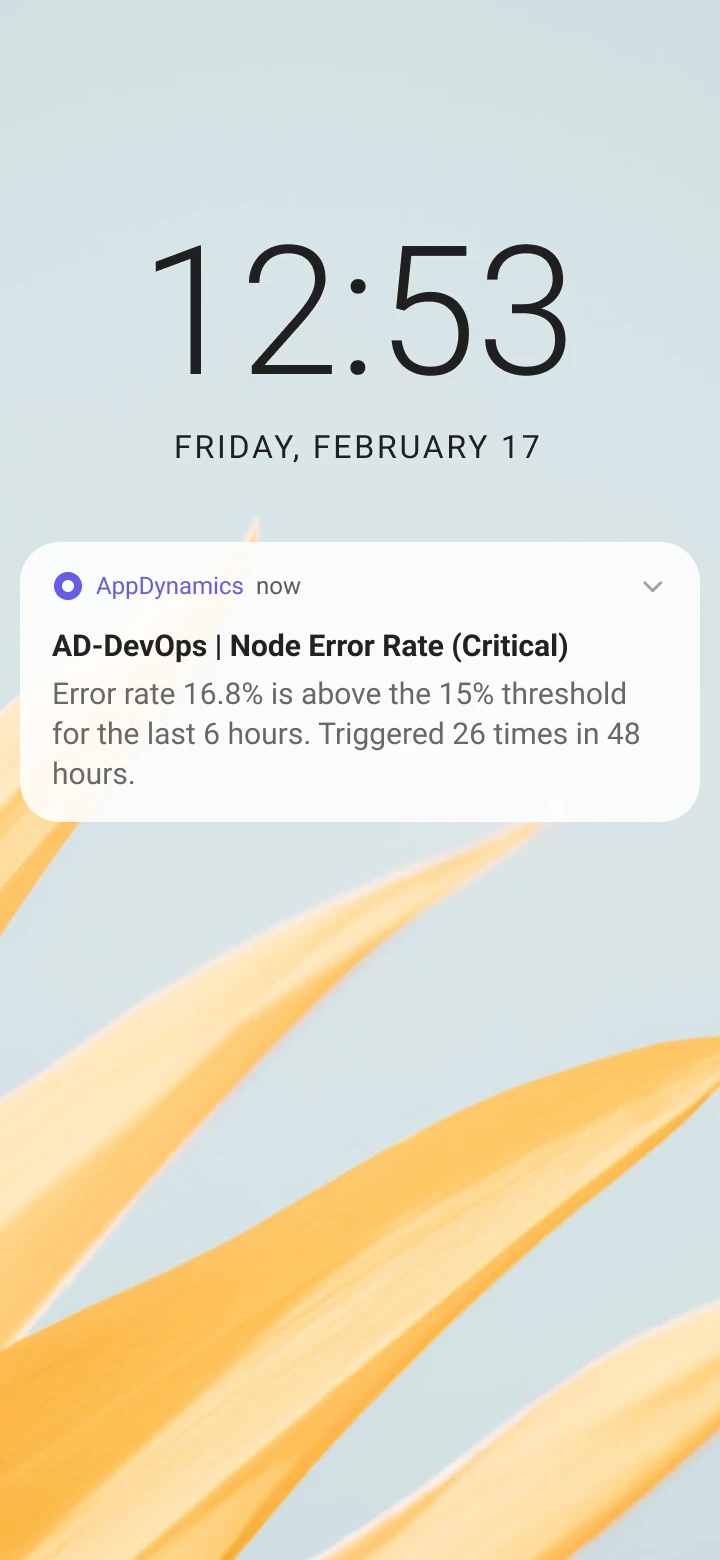
More than half of the app's users were on Android, so the notification was written to work in Android's system notification as well as on an iOS lock screen.
03 · Research
Twelve interviews, and a survey that ranked the fix.
The UX research team's survey of 168 people ranked an alerts view first and rich push notifications second.
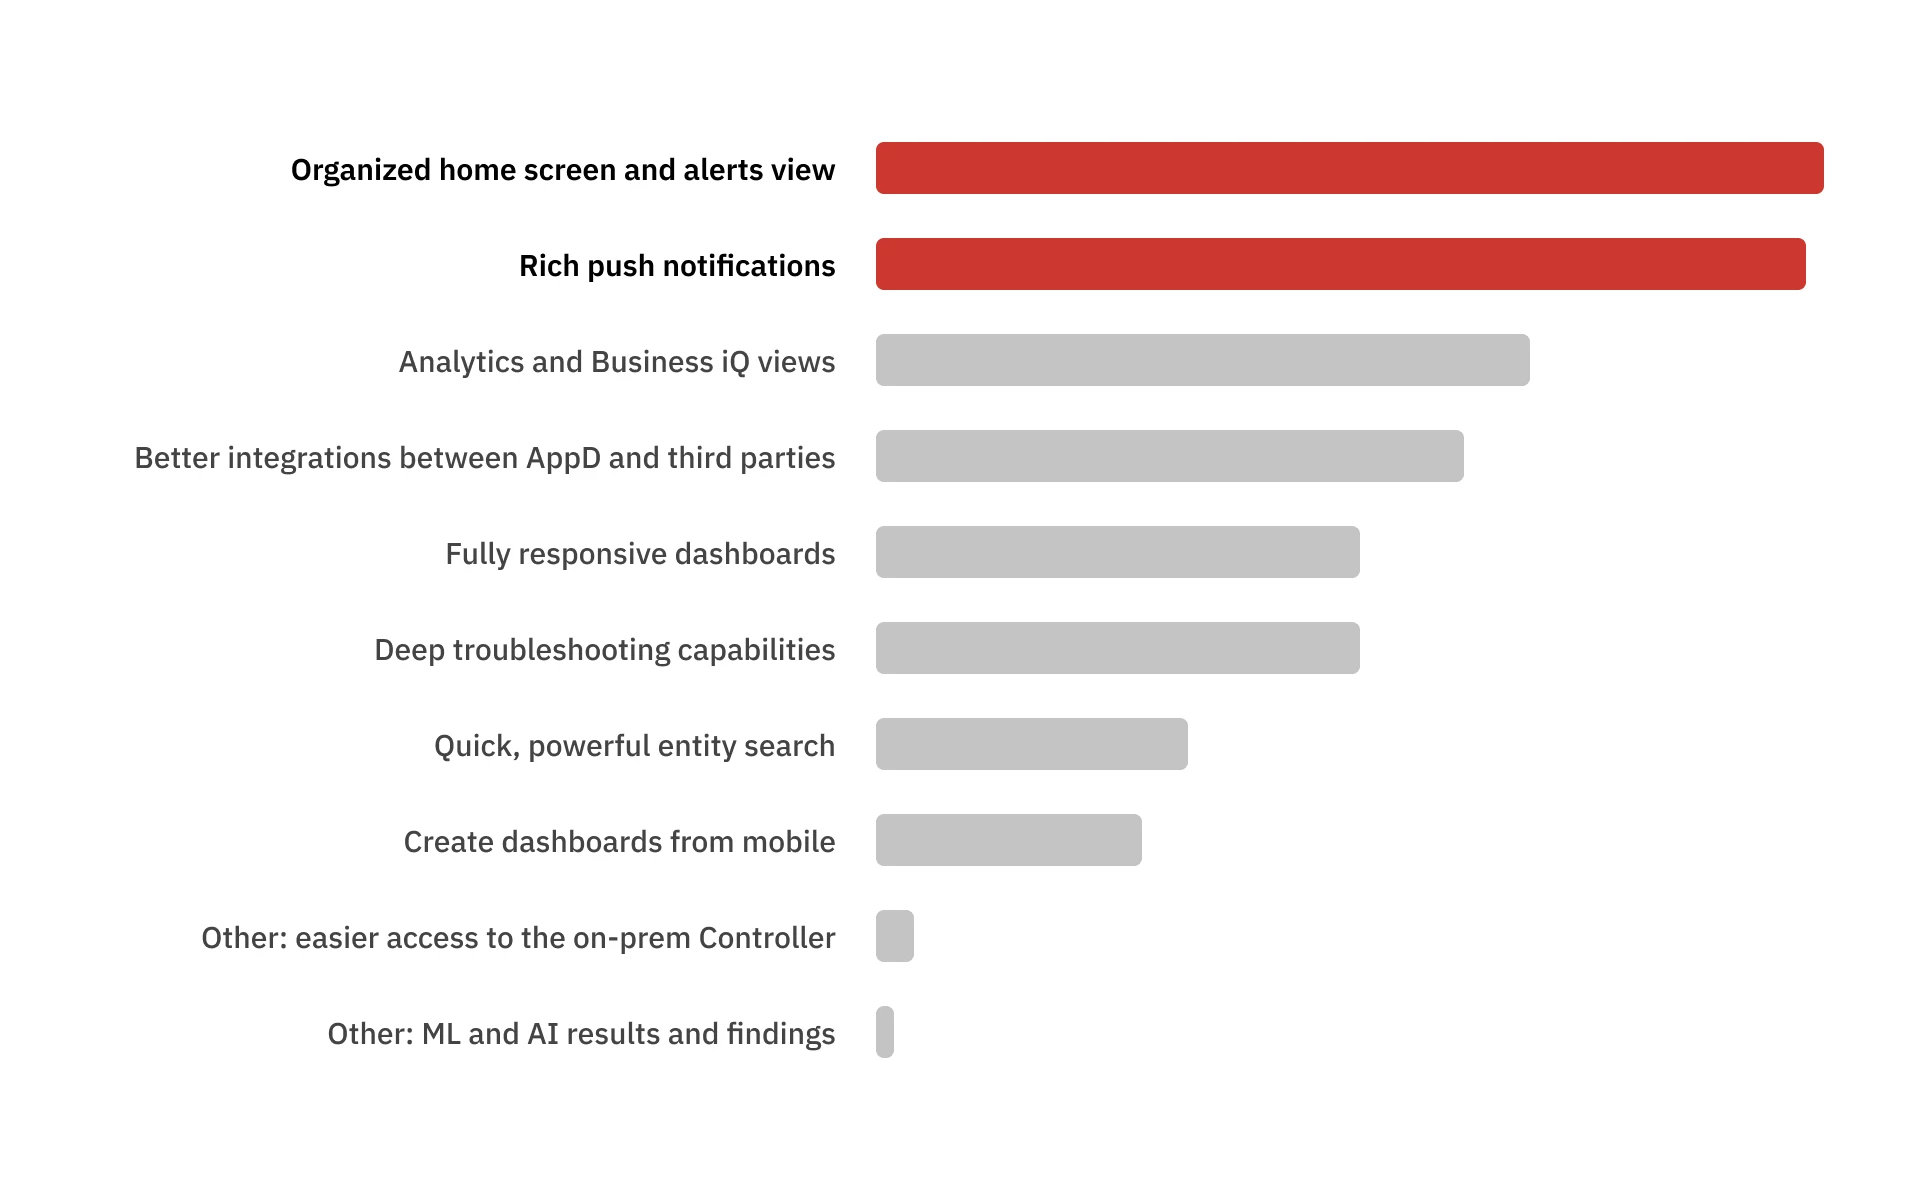
After that survey, I ran twelve discovery interviews to find the pain points and who felt them. The person this is for is the first line of defense: whoever is on call, watching alerts and deciding what needs a response. Most reacted to notifications, and the notification gave them too little to act on.
Usability testing of the first designs asked for three things: less configuration, more detail on ongoing issues, and less alert flood in the feed. The default rule, the detail screen and the count on each card answer them in that order.
04 · Constraint
A triage surface, not a troubleshooting tool.
Three things set the shape. It had to stay inside AppDynamics' enterprise design system. I had one summer. And mobile was scoped to triage: deciding whether an alert needs you, with root cause left to the web app. People in the research described the app the same way.
The mobile app is good enough to tell me there's a problem, but not enough to troubleshoot.
The mobile app is for when you're not connected to your laptop and you want a sneak peek at how your application is doing. It's a handy thing to have, but not sufficient.
05 · Decision
Numbers, not a chart.
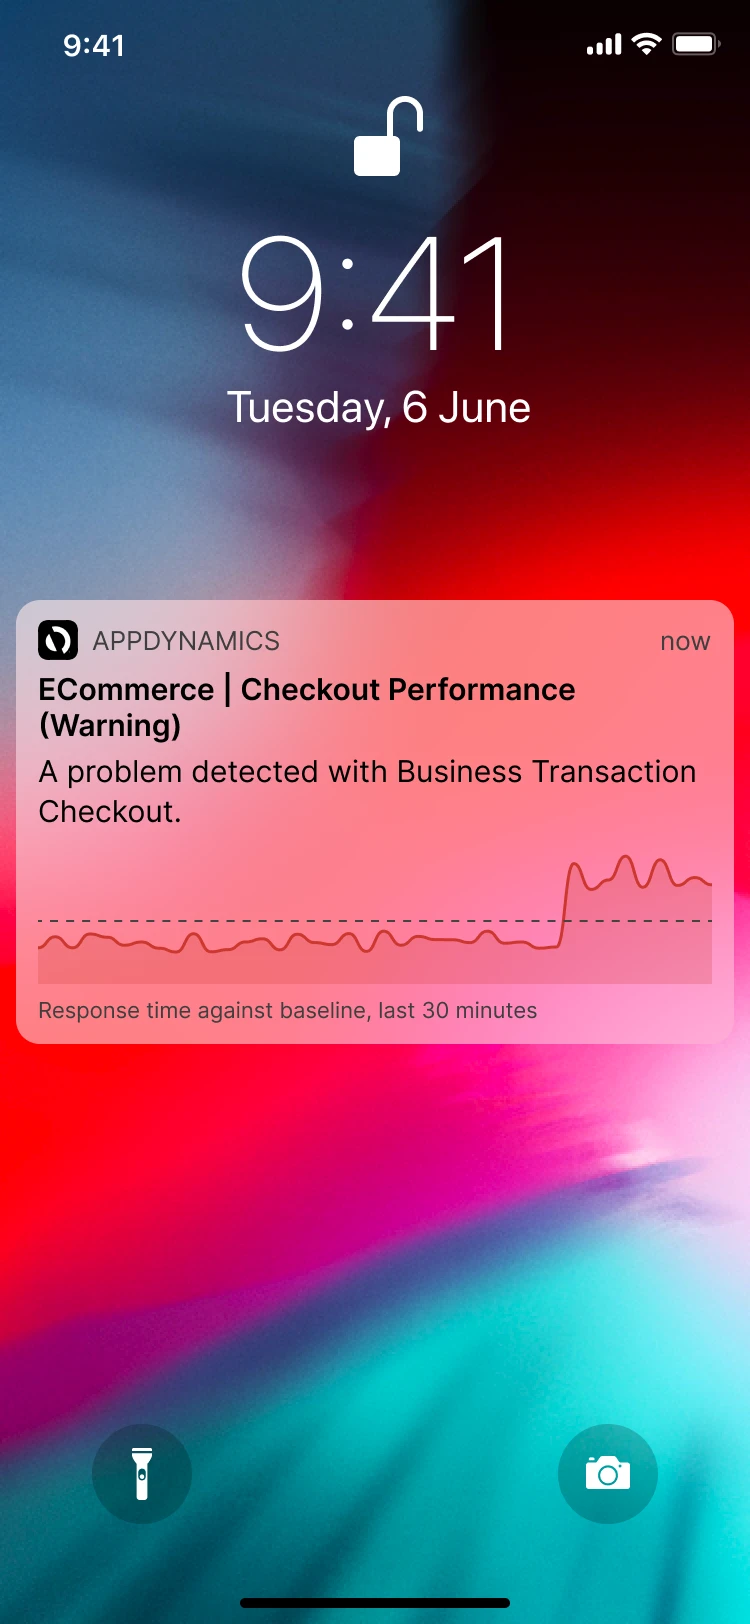
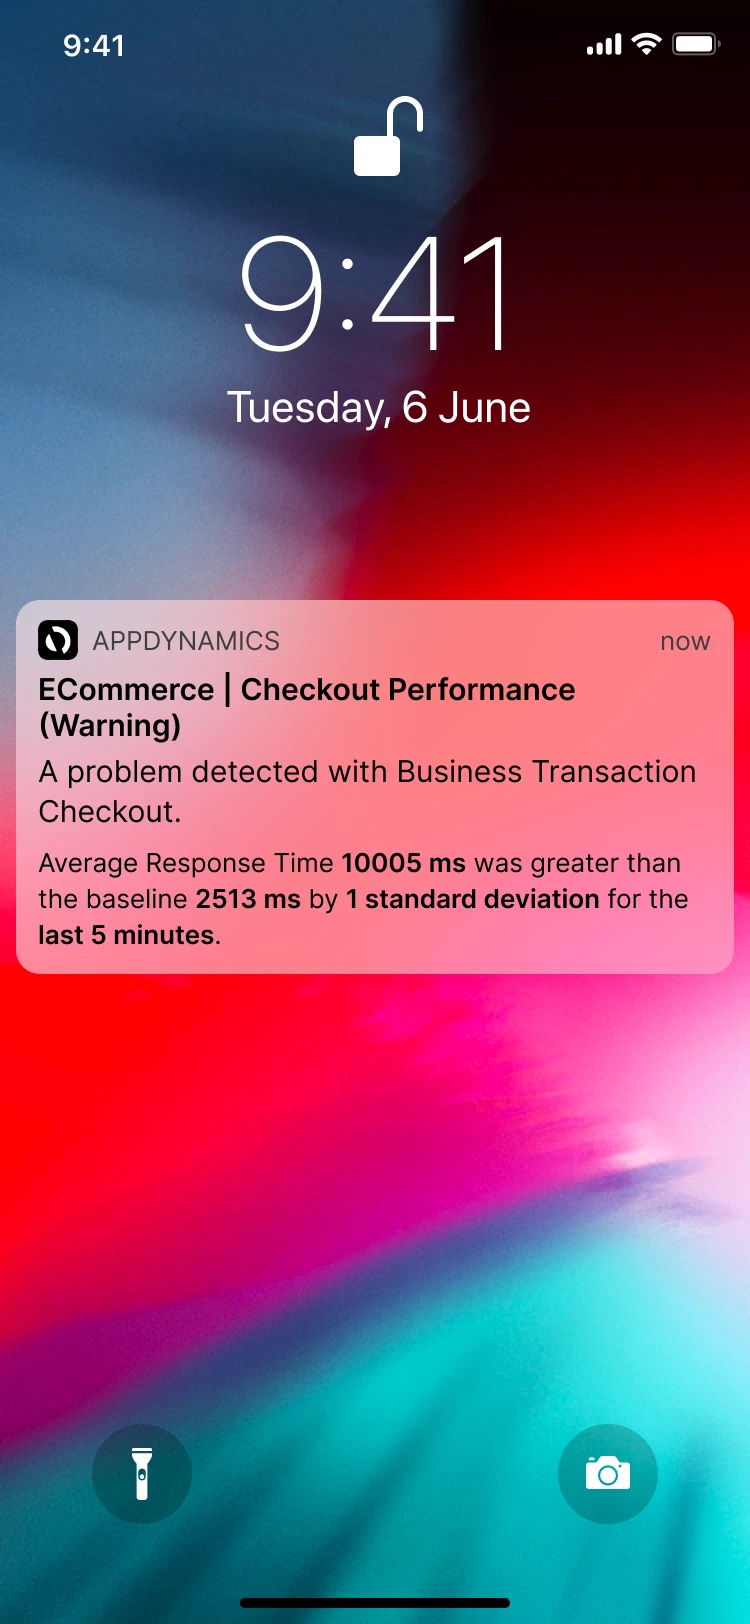
Three ways to fill a notification: a graph, the metric values, or the impact on end users.
Chosen
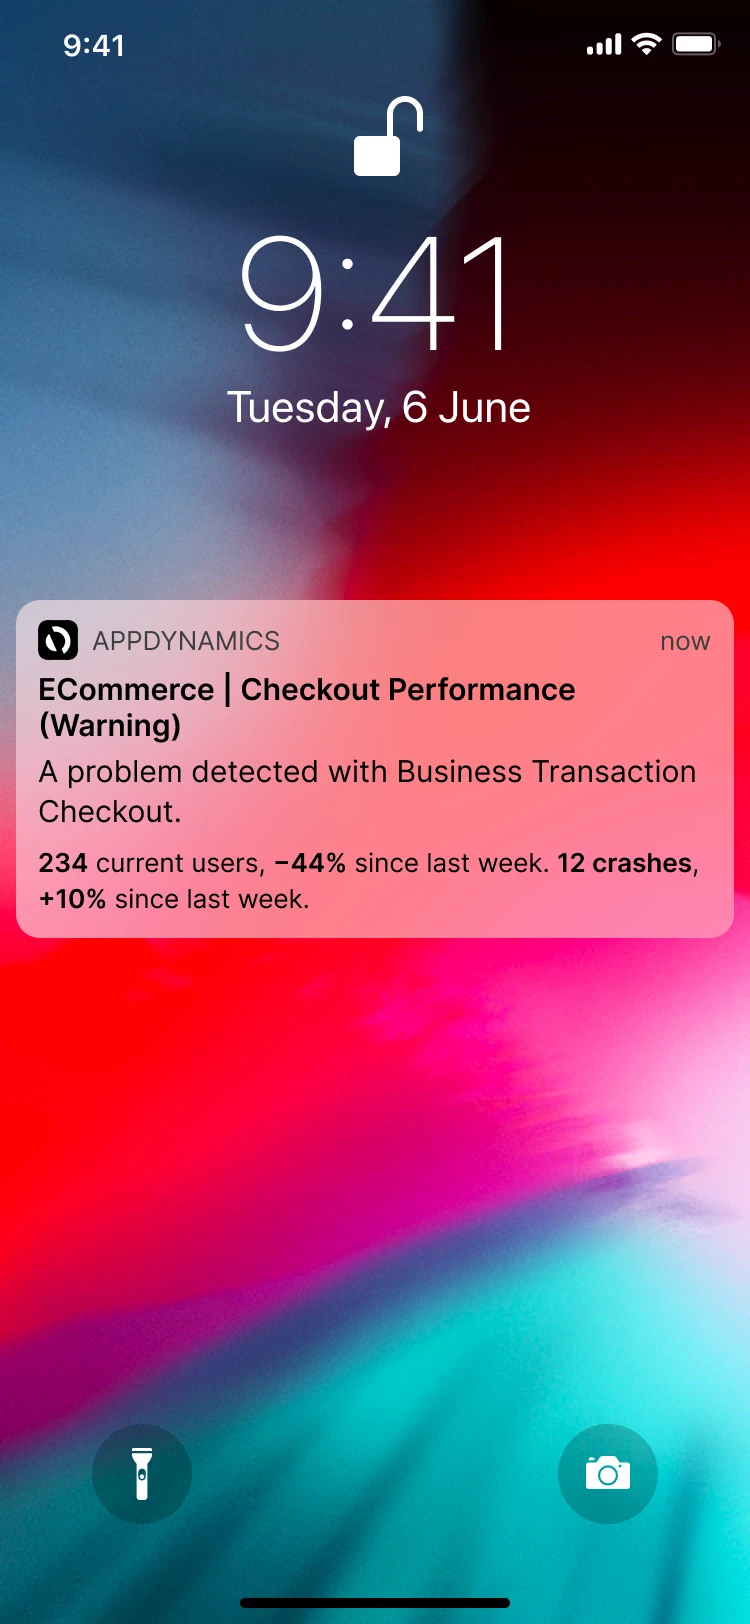
After the first couple of design iterations, I showed all three at a presentation day and asked people to pick one. Half of them said they worry more about the end user, and metric values still won.
- Chose
- The metric values that broke the rule
- Instead of
- A graph, or the end-user impact
- Because
- Most of the people I asked picked it. They wanted the actual deviation from what they had configured.
06 · Design: Feed
Triage before you tap.
Each card states the condition and its value, newest first.
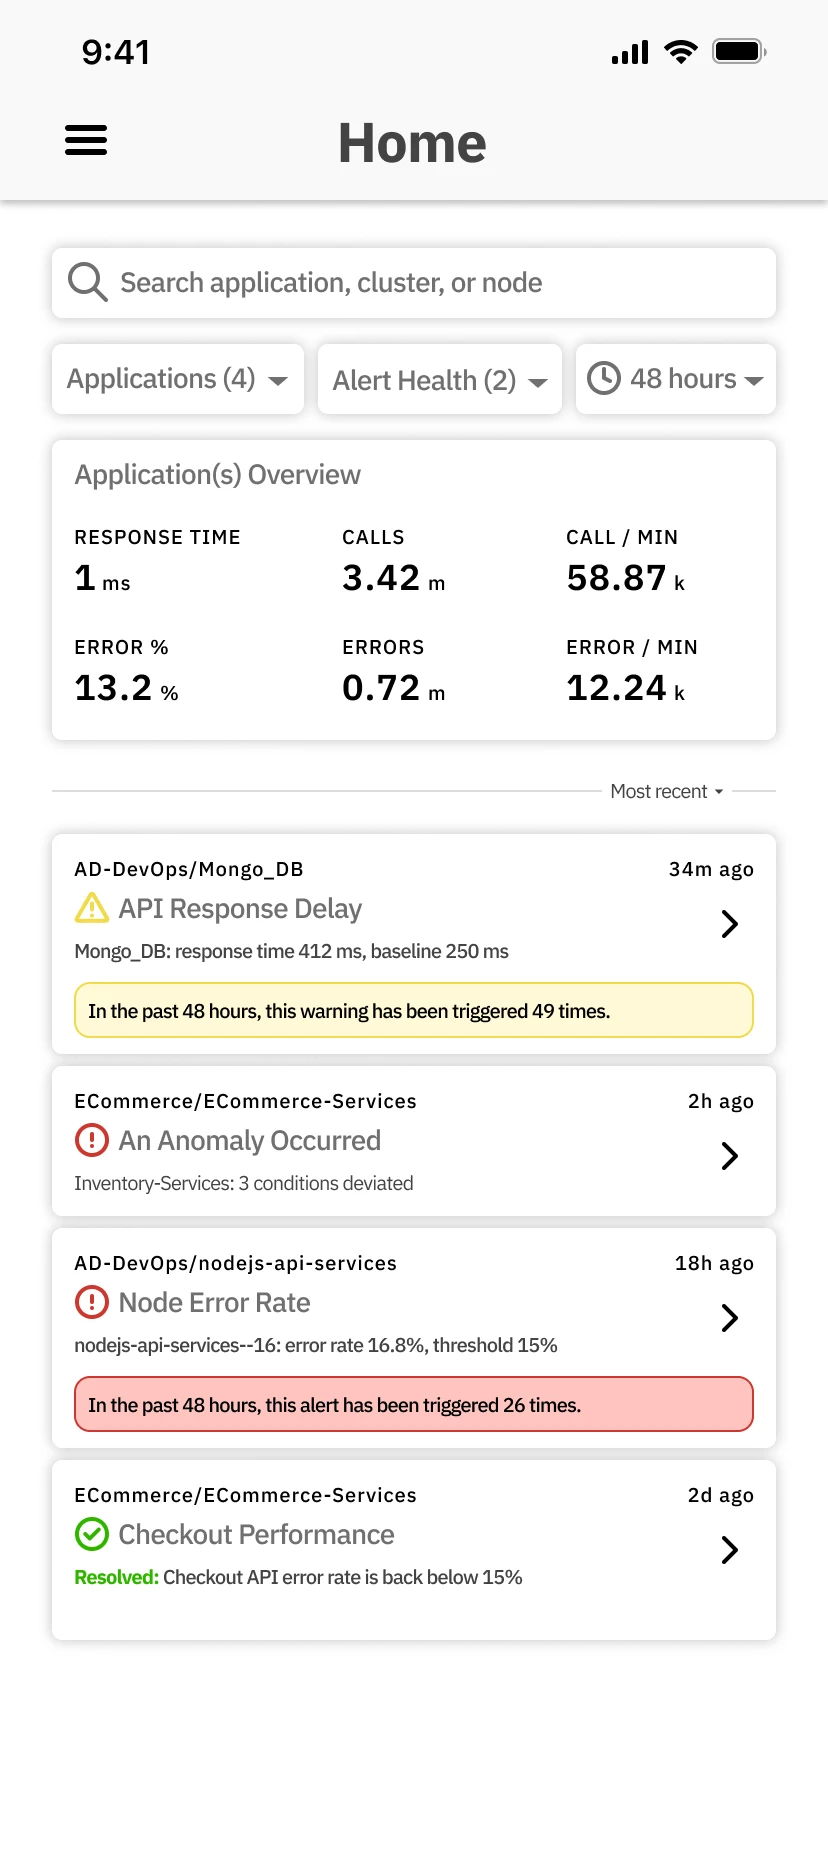
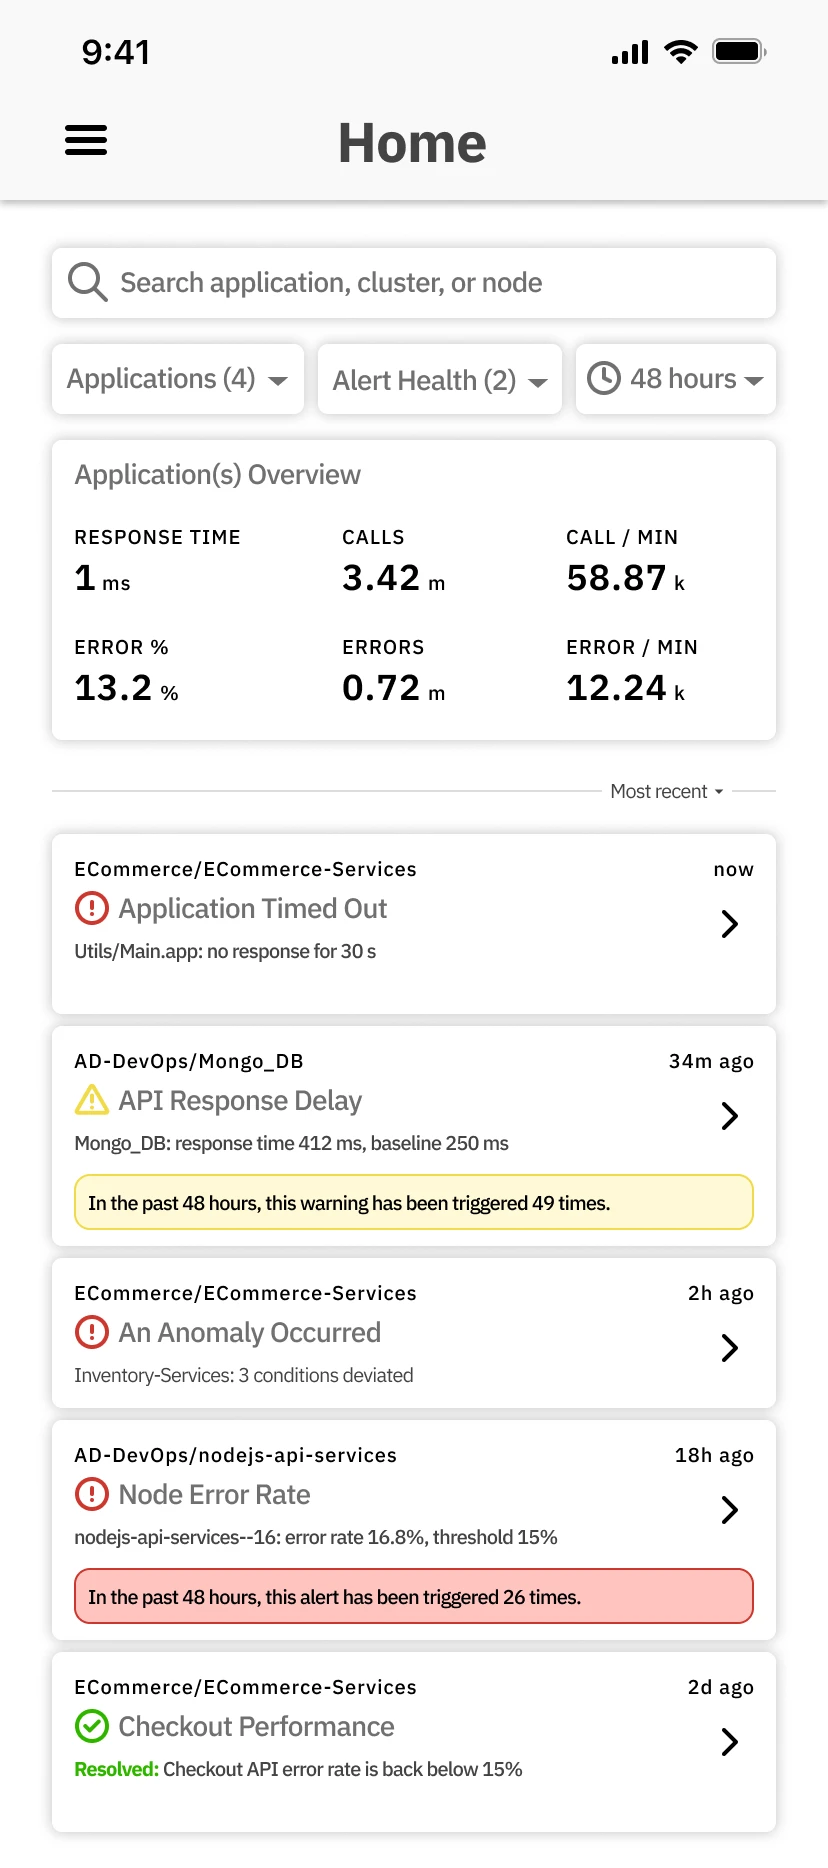
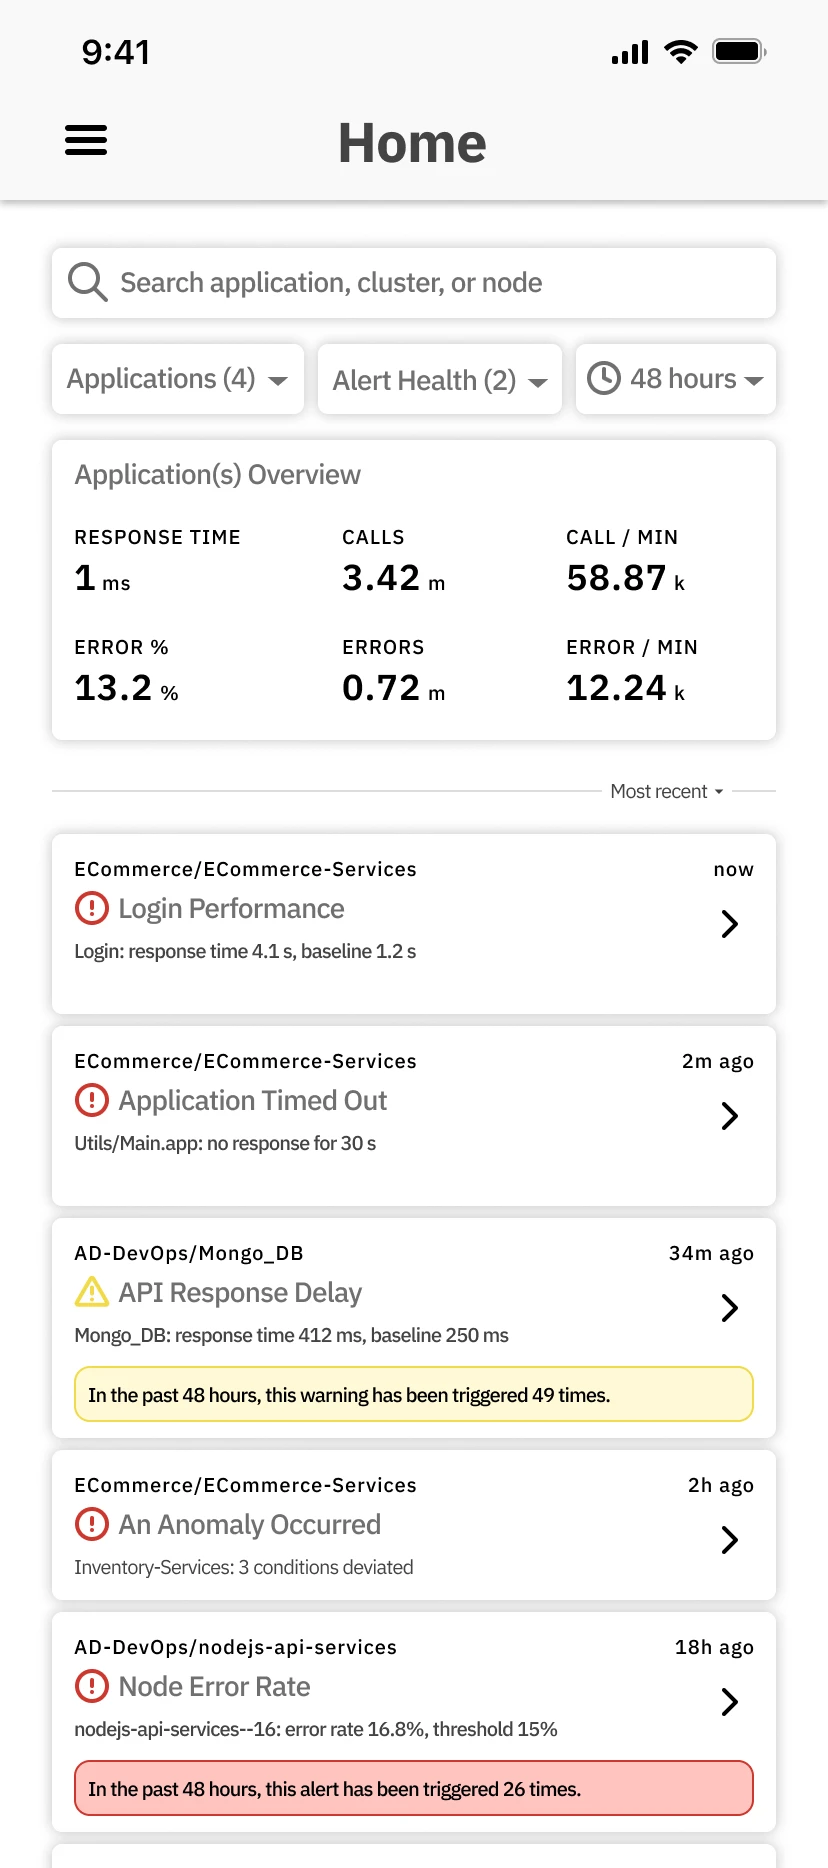
The question from the lock screen continues one tap in: does this need me now, or can it wait? The feed answers it per alert. Usability testing asked for a way to cut alert flood, so an alert that keeps firing carries its count on the card: "In the past 48 hours, this alert has been triggered 26 times."
Application teams are looking for root cause and the mobile app helps with the initial triage stage. If they just got paged, is this absolutely something I have to work on or can I wait for the morning? It might be something that will automatically remediate.
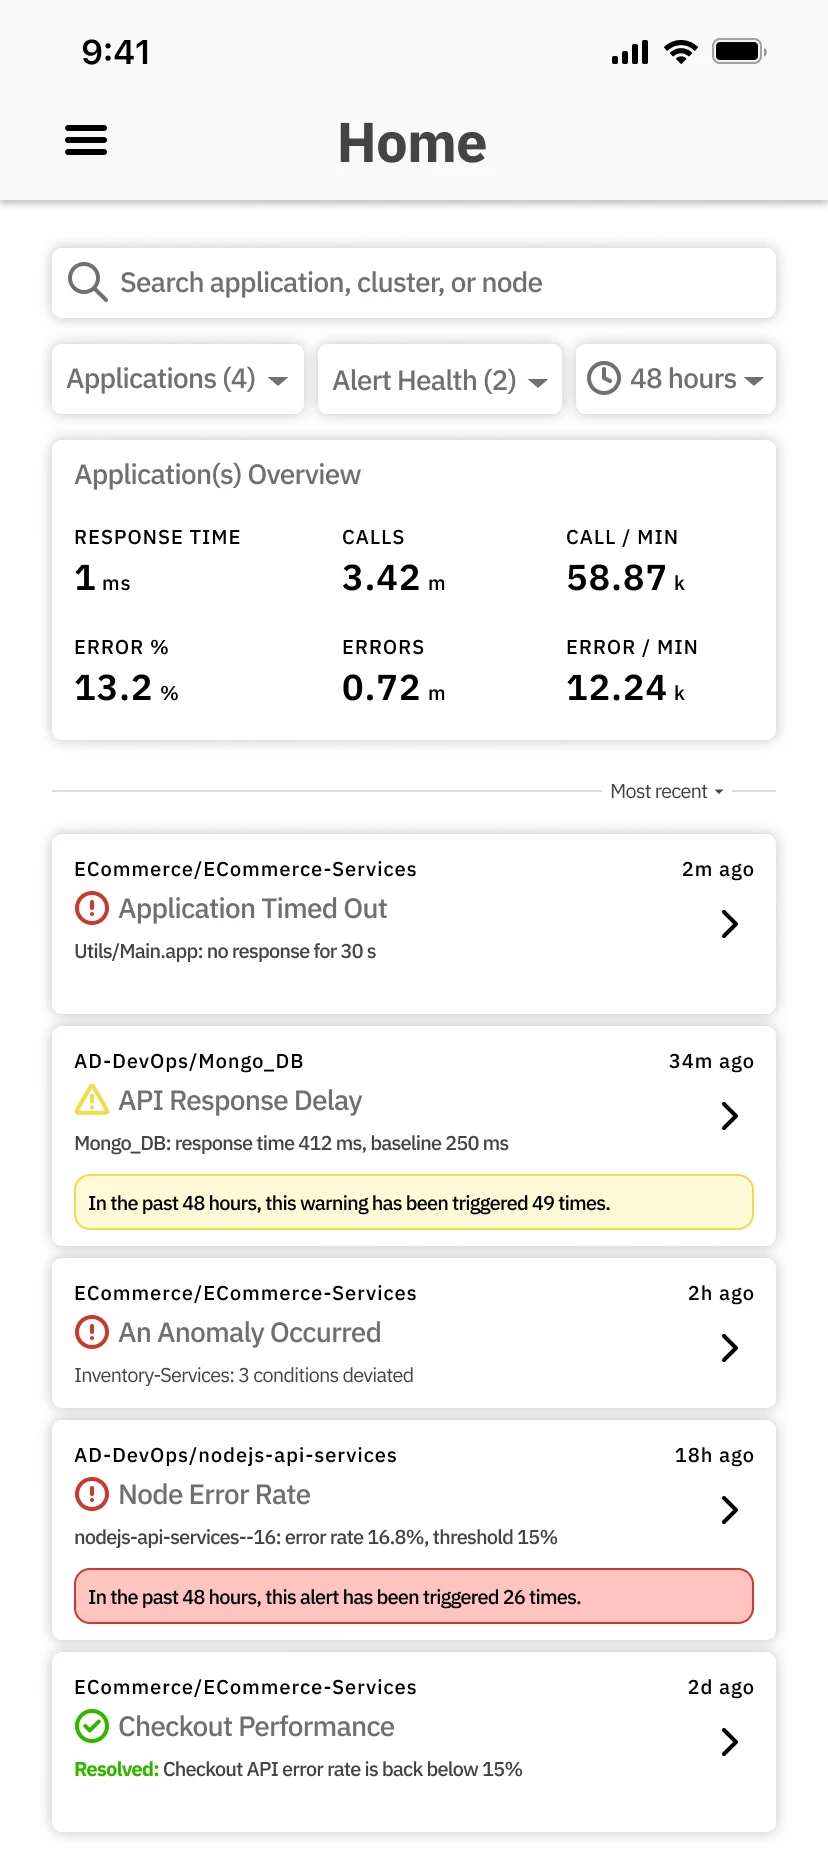
- The condition, on the card. Error rate 16.8%, threshold 15%, before any tap.
- The count, against alert flood. How often it fired in the past 48 hours.
- Resolved, in green. A cleared alert stays in the feed, marked as cleared.
07 · Design: Detail
Enough to decide, without the laptop.
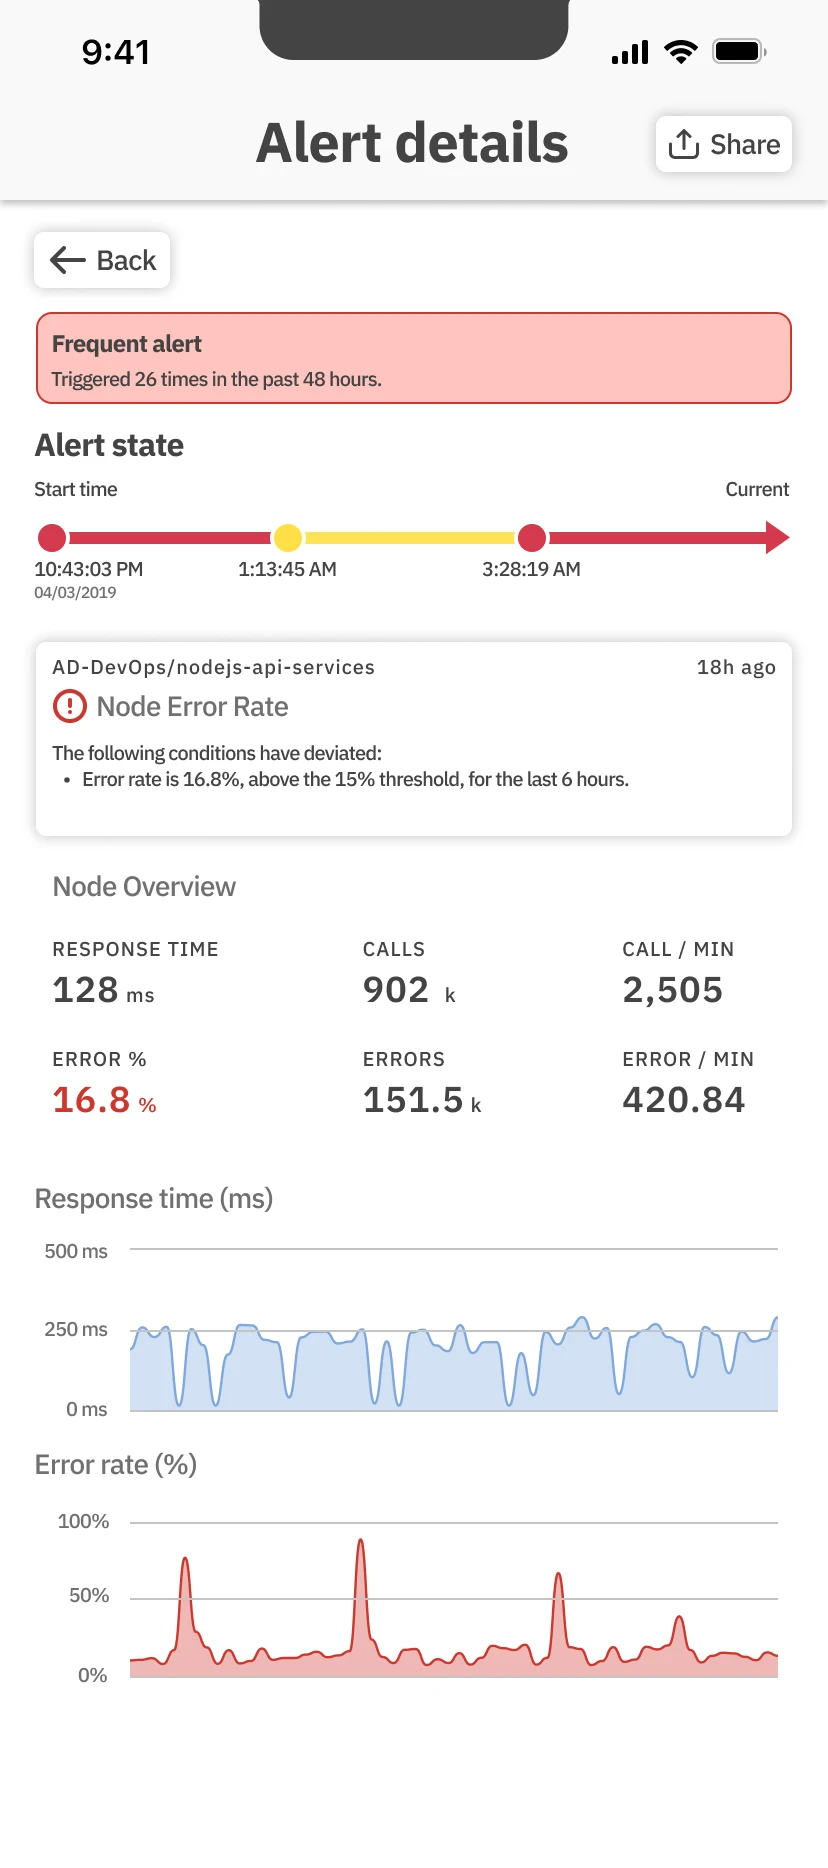
The timeline, the violated condition, the node's key metrics and two charts, on one screen.
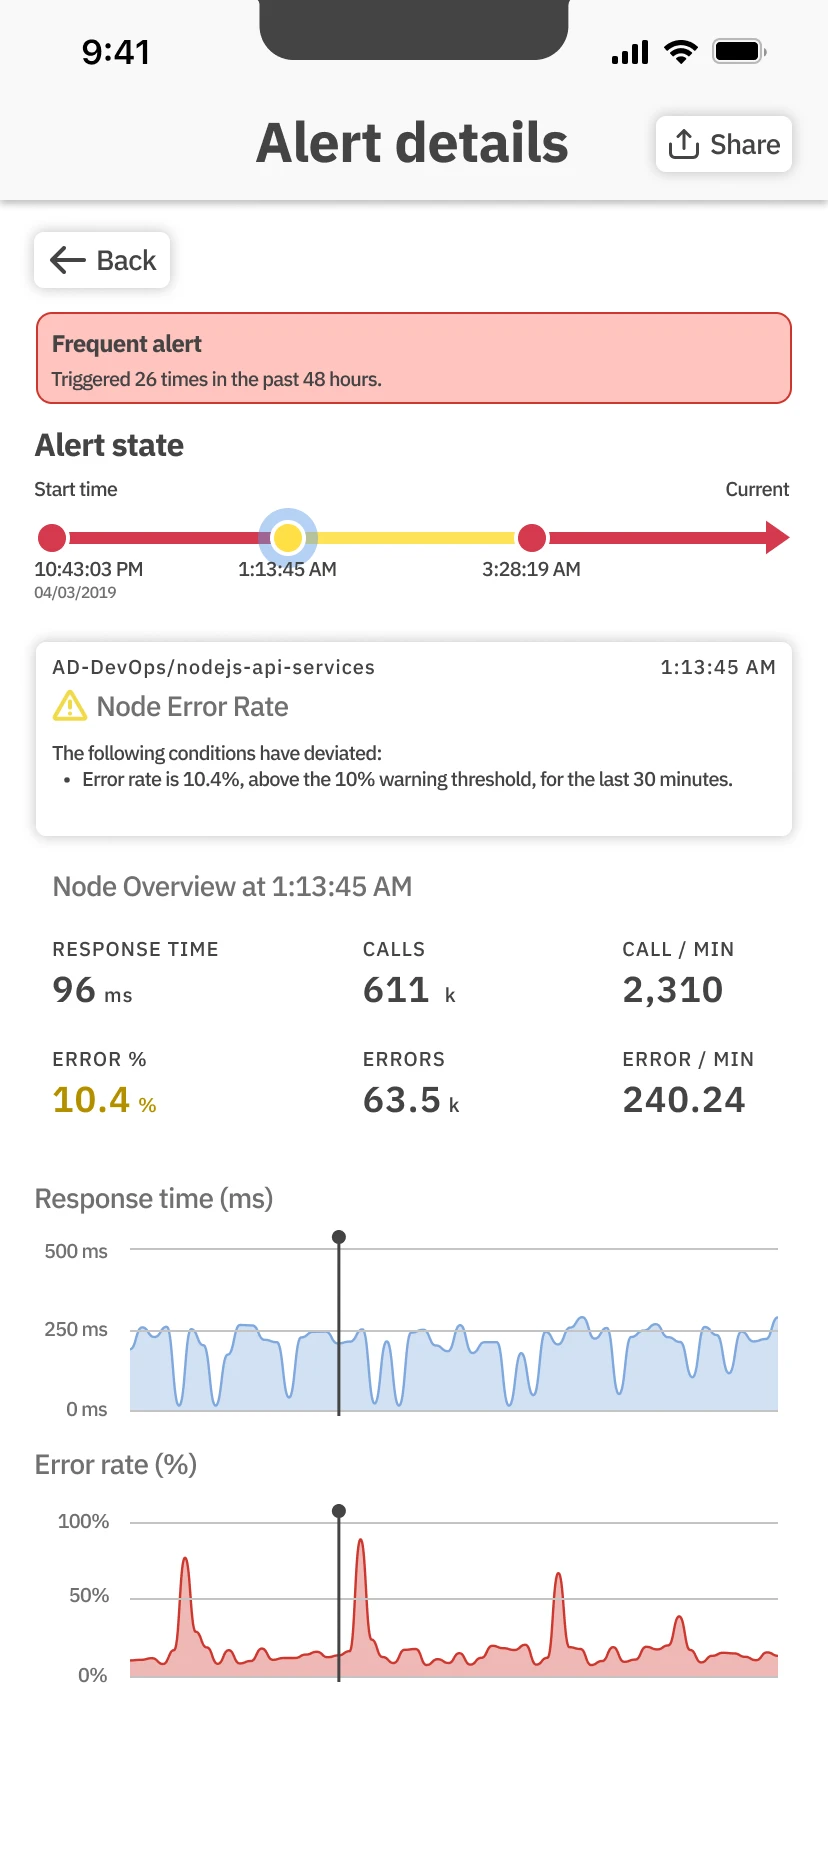
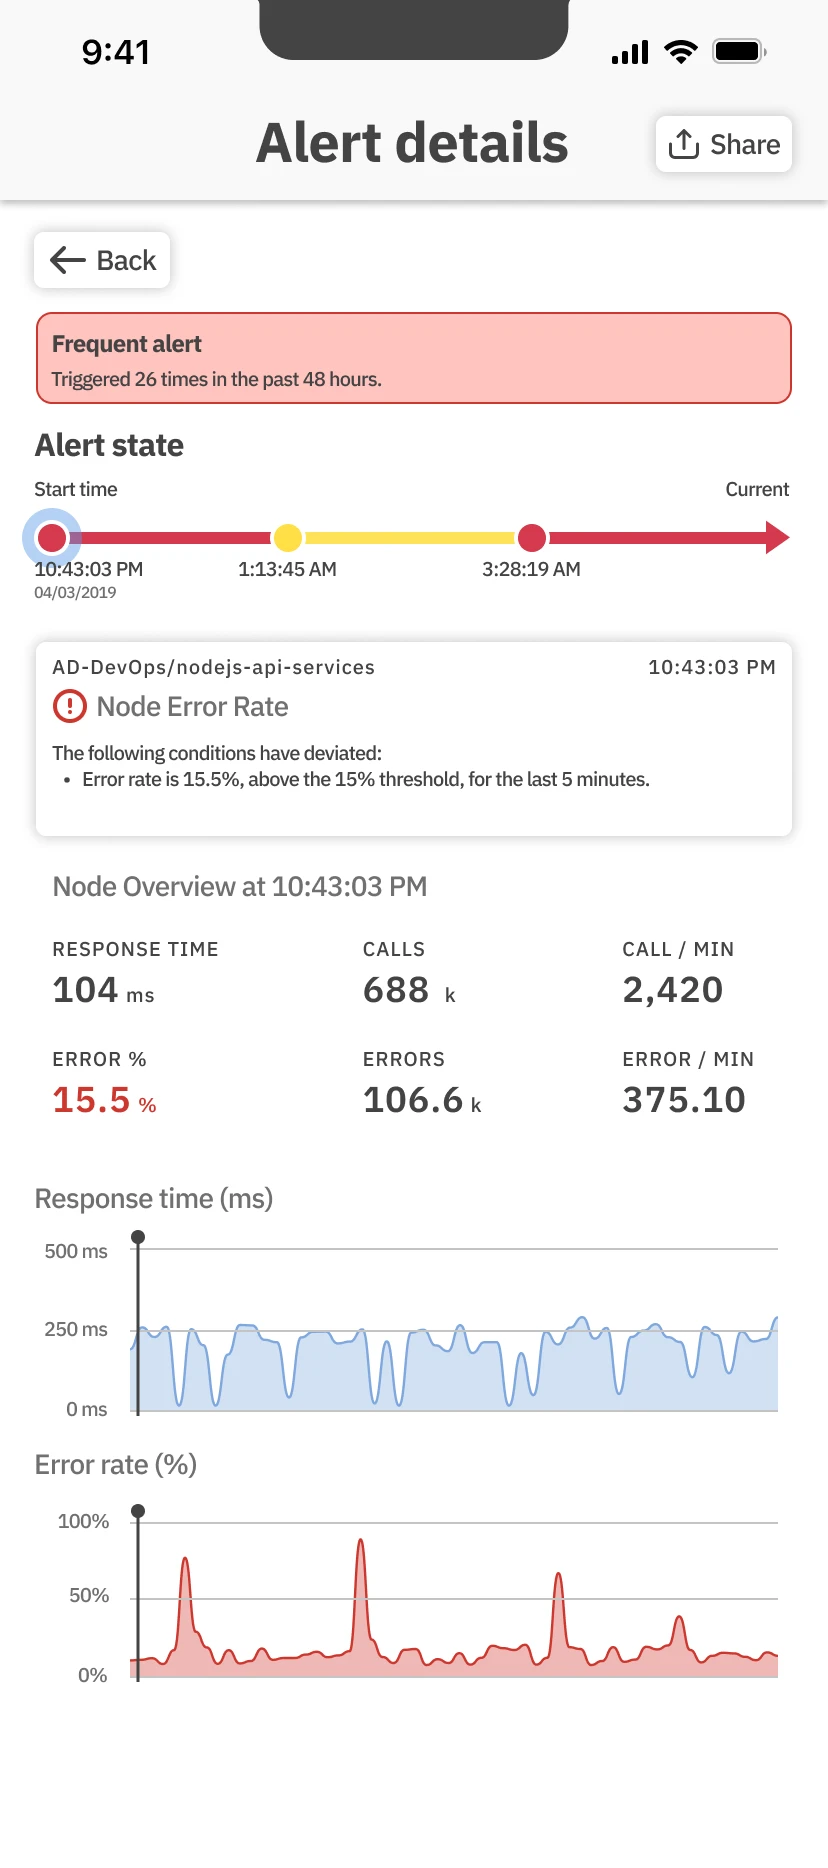
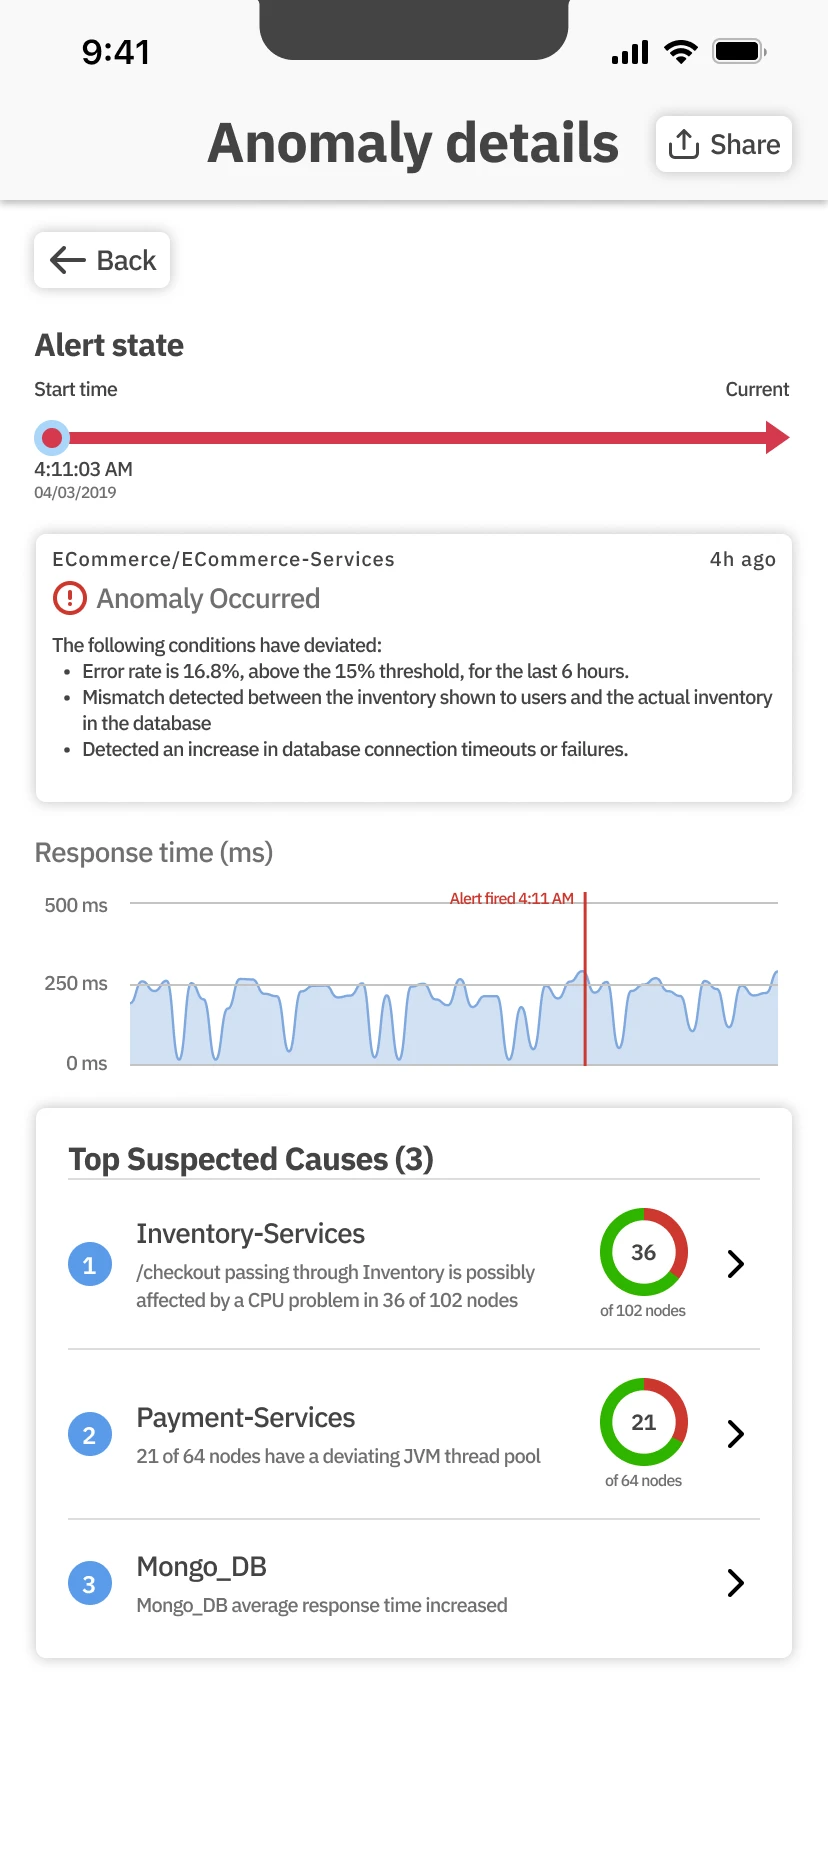
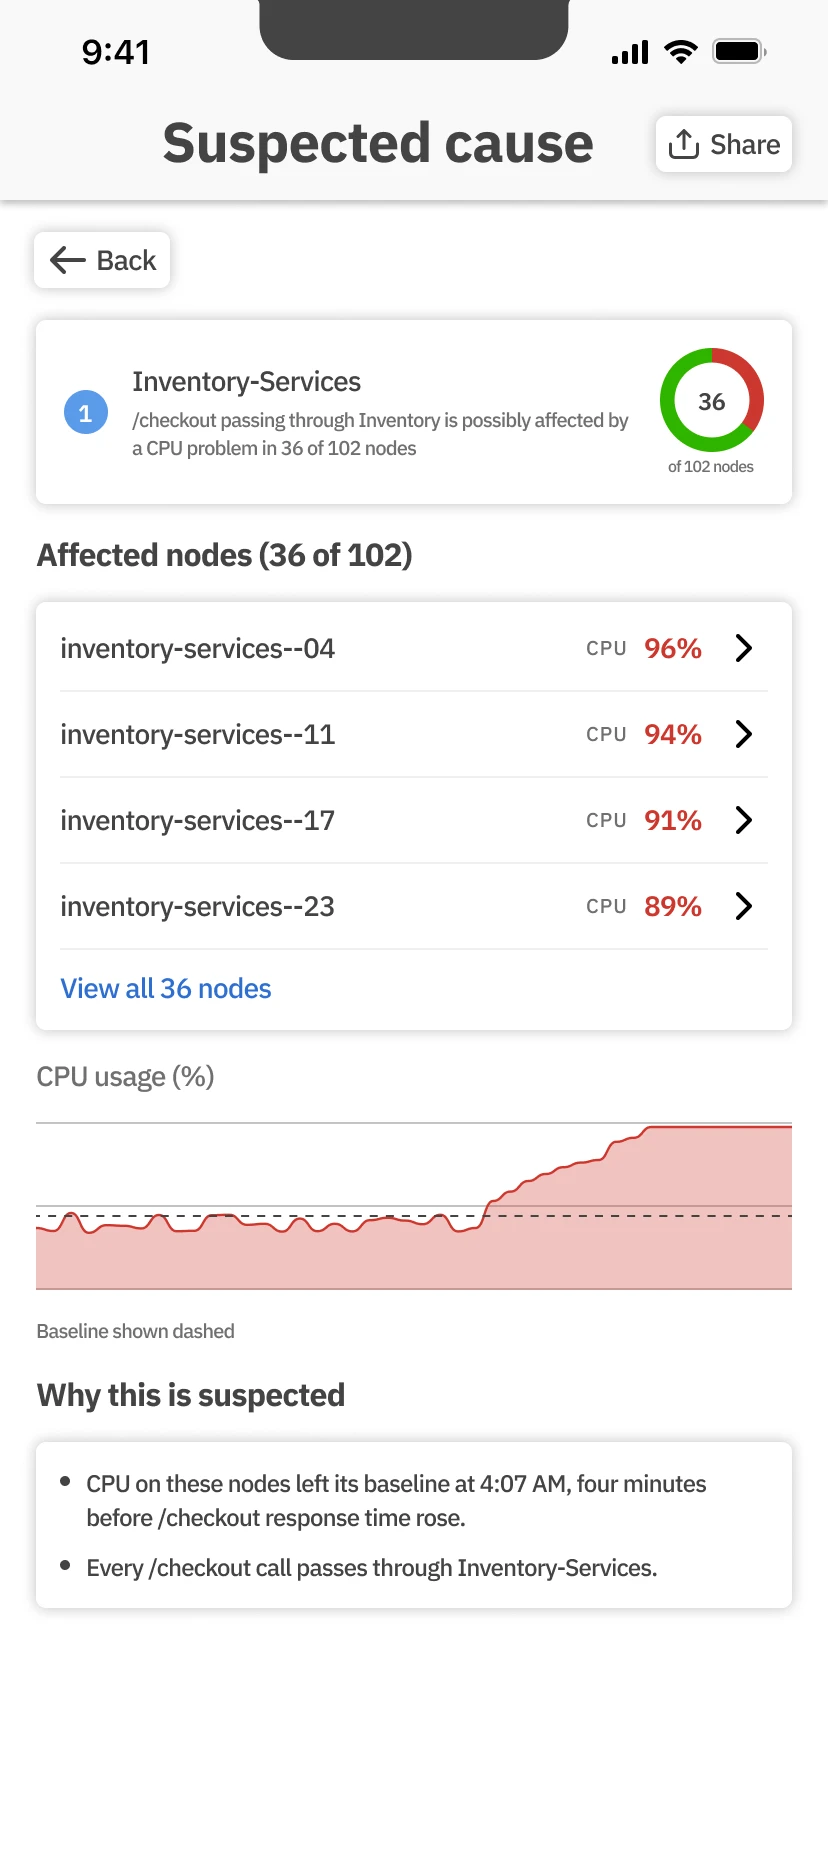
The detail screen exists so that nobody has to VPN in to find out whether an alert matters. Tapping a point on the timeline changes the condition, the metrics and the chart marker together.
An anomaly lists its suspected causes, and each opens to the nodes and the metric behind it. It stops there on purpose: root cause stays with the web app.
I was on a business trip and woke up at 3am. Instead of opening my laptop and VPN'ing in, I just want to use the mobile app and check the activities of my JVMs.
- Frequent, up top. The count carries over from the feed.
- A timeline to tap. Each point changes the condition, the metrics and the chart marker together.
- The condition, in words. What deviated, by how much, for how long.
- The metric that broke, in red. Among the node’s key metrics.
08 · Design: Rules
Only get paged for what you chose.
A rule picks an application, its health rules, a severity and, optionally, a condition.
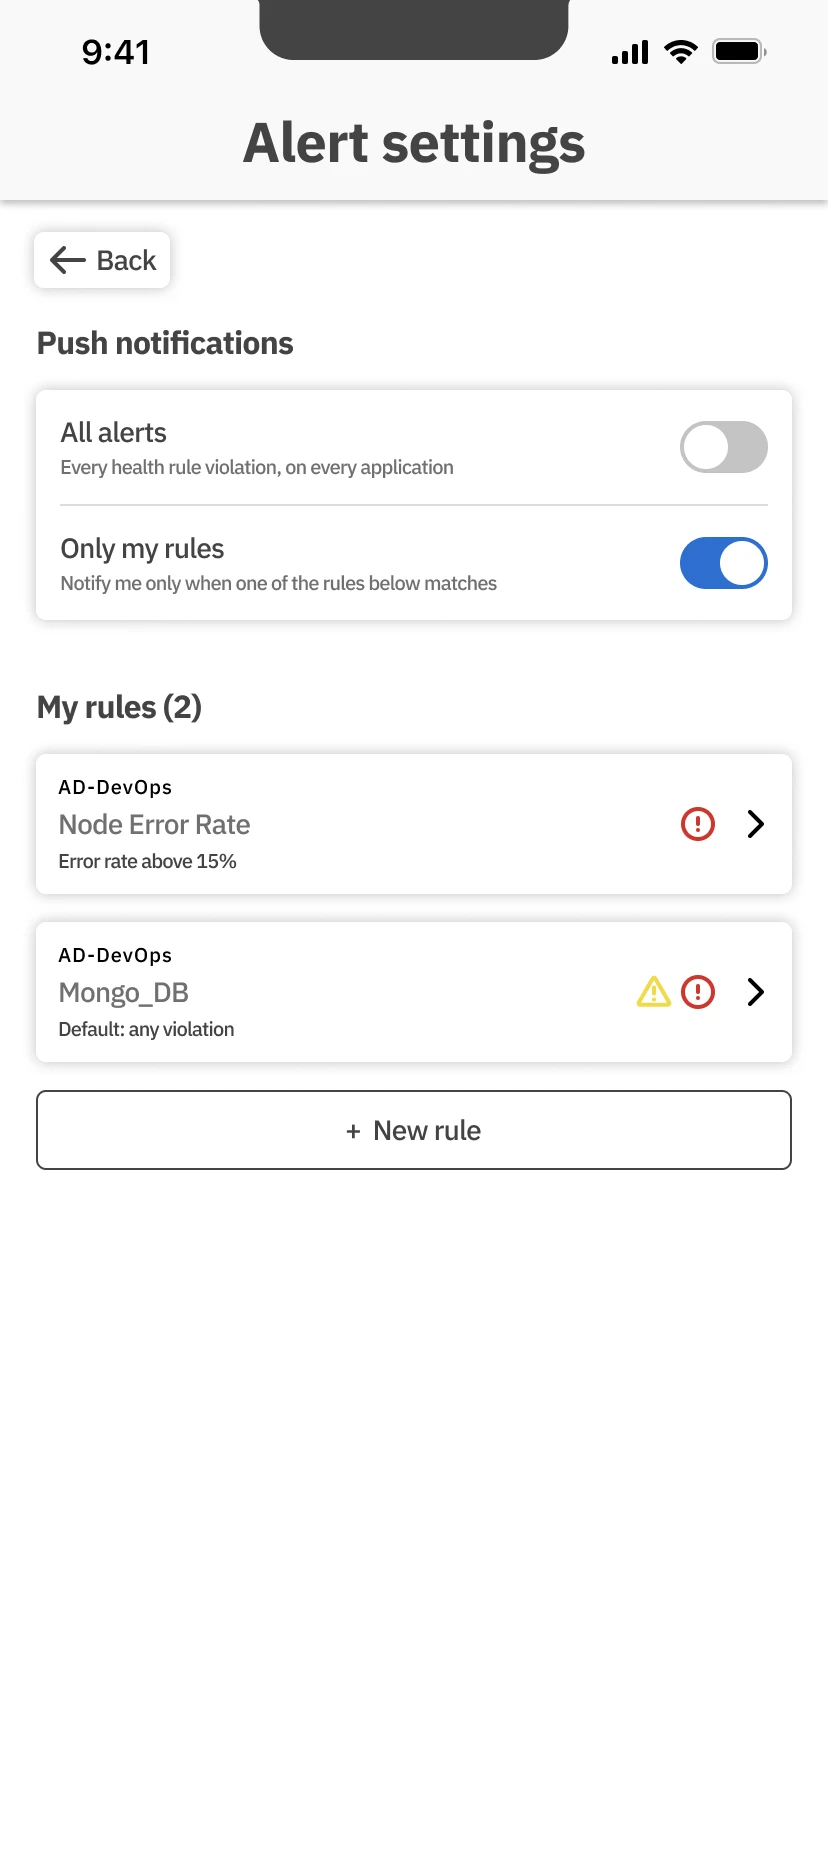
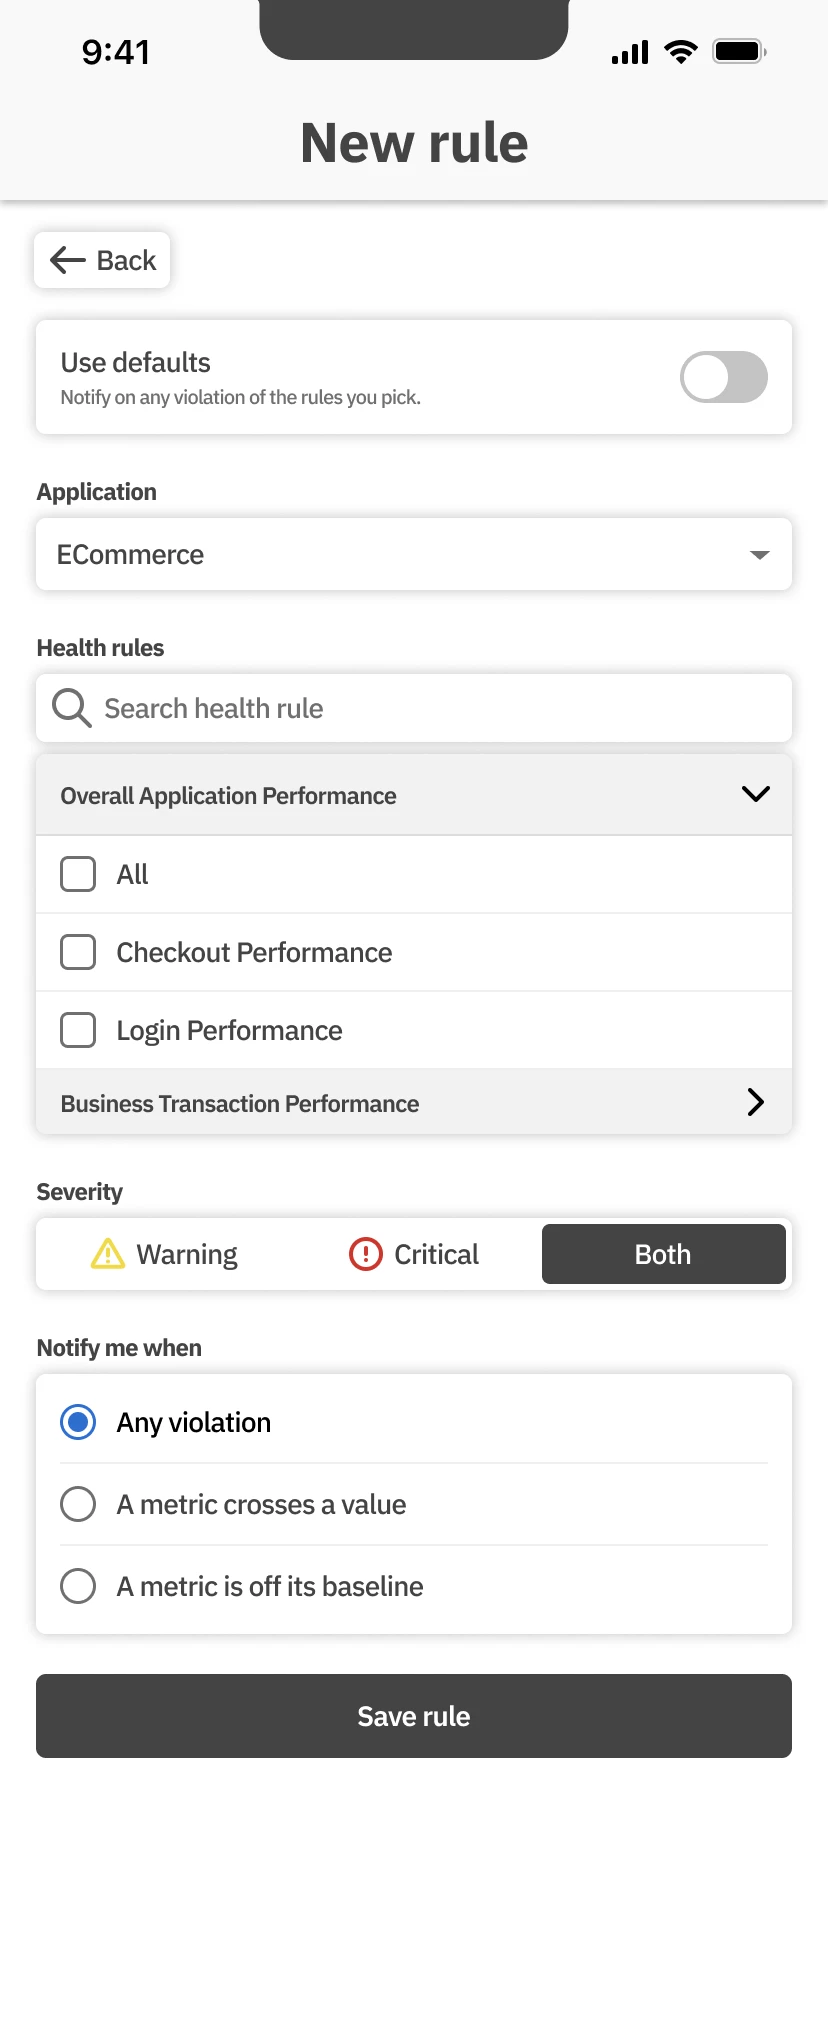
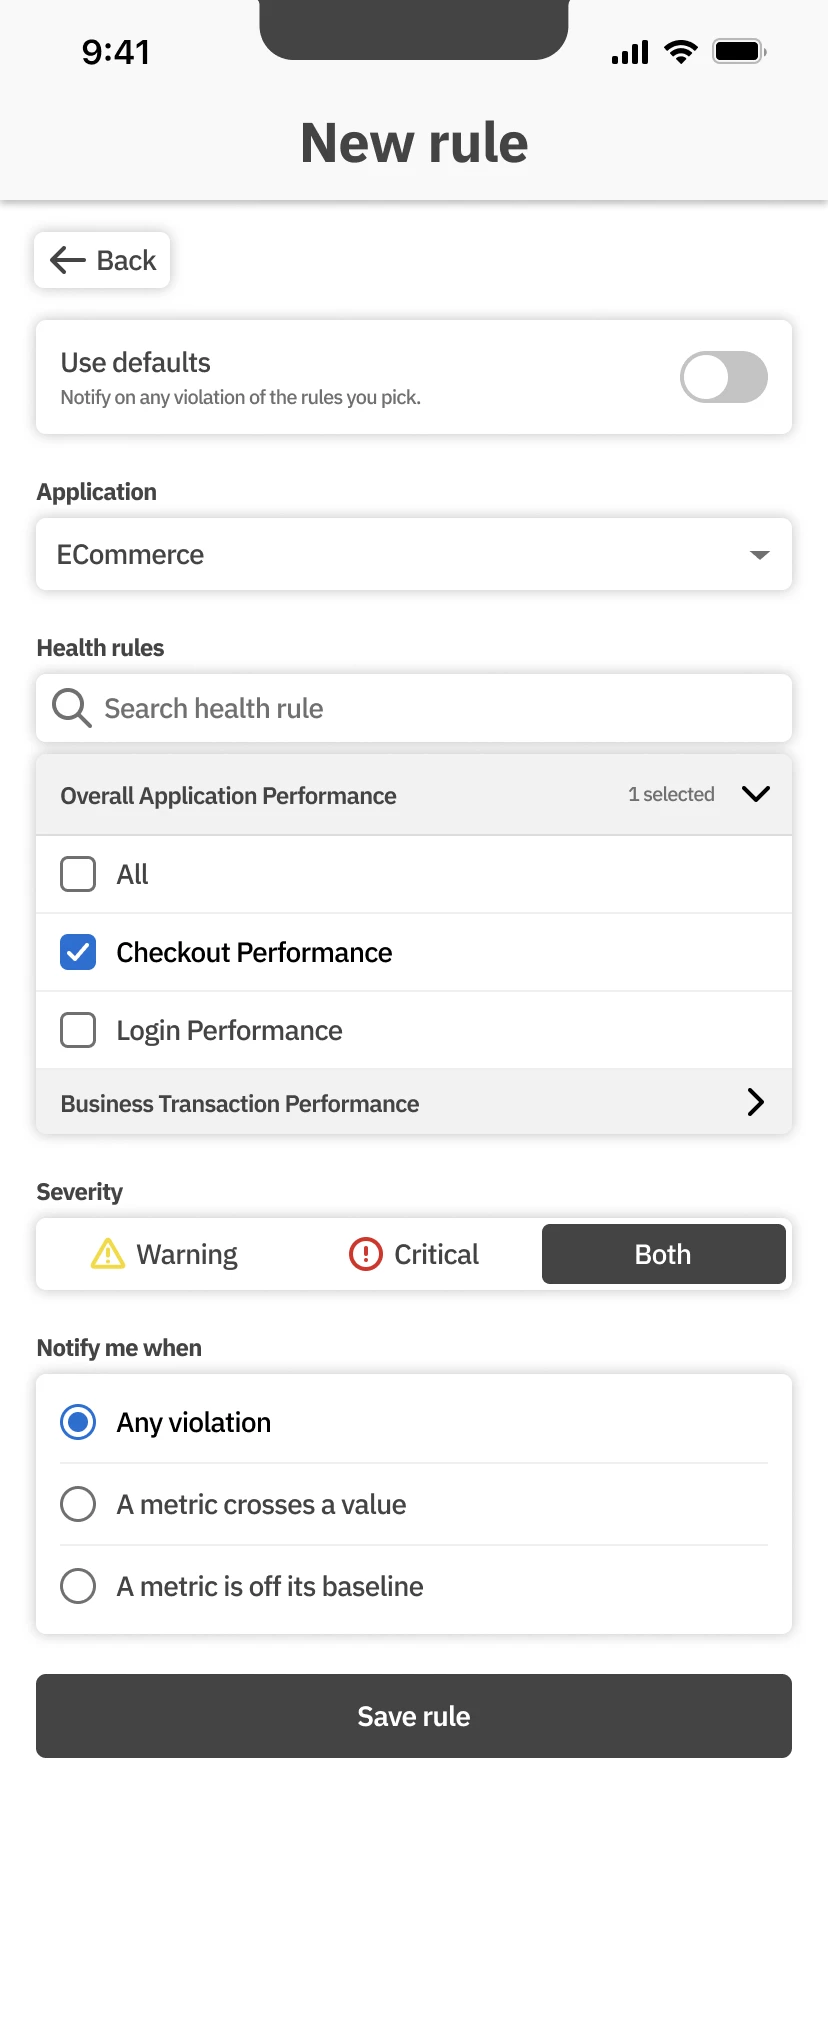
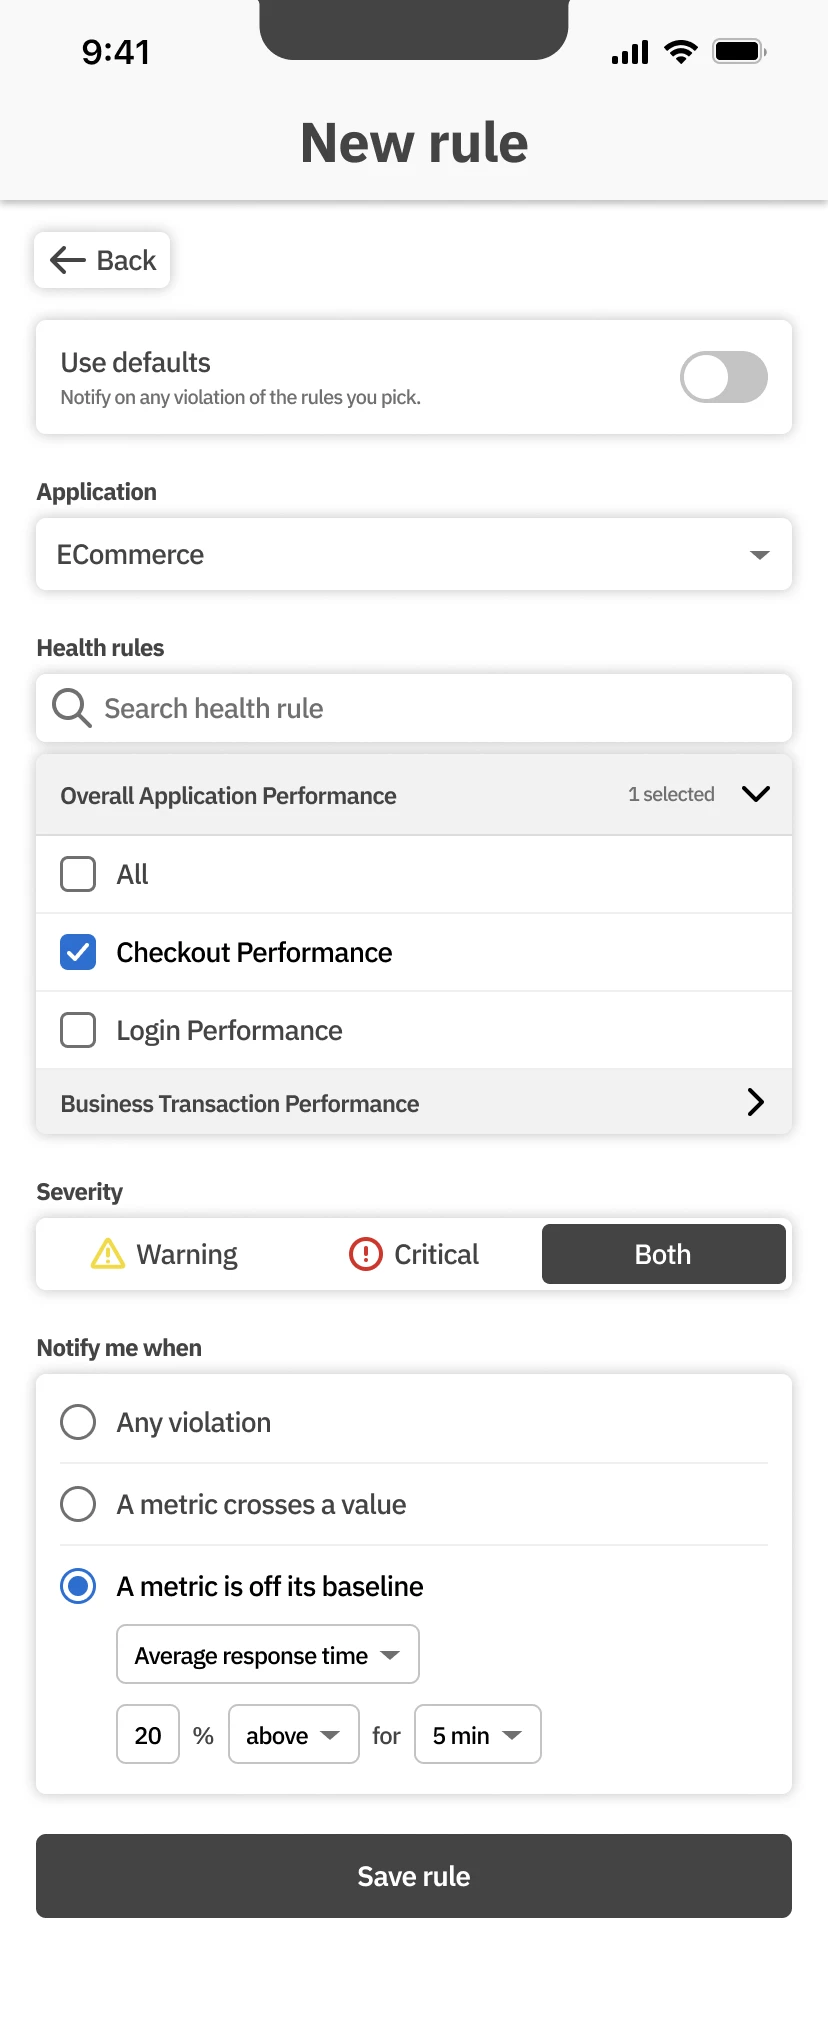
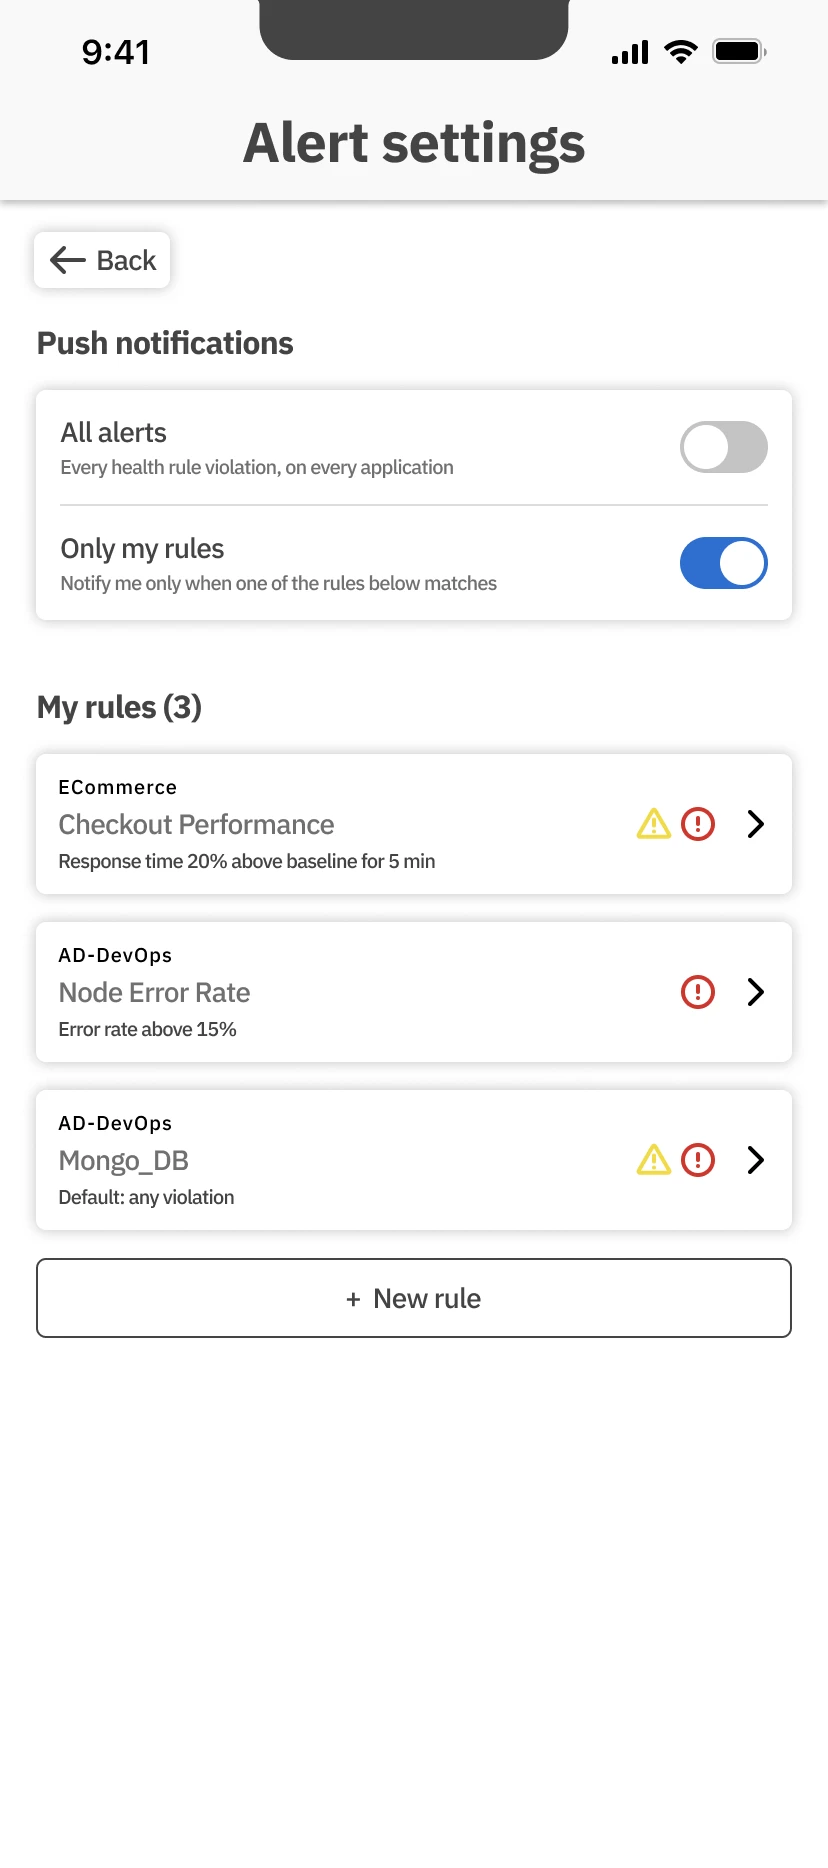
Not every alert is worth a push to every person. The condition can be a metric crossing a value, or drifting a percentage off its baseline. Usability testing asked for less configuration, so a default skips the builder entirely.
09 · Design: Share
Hand it to the team.
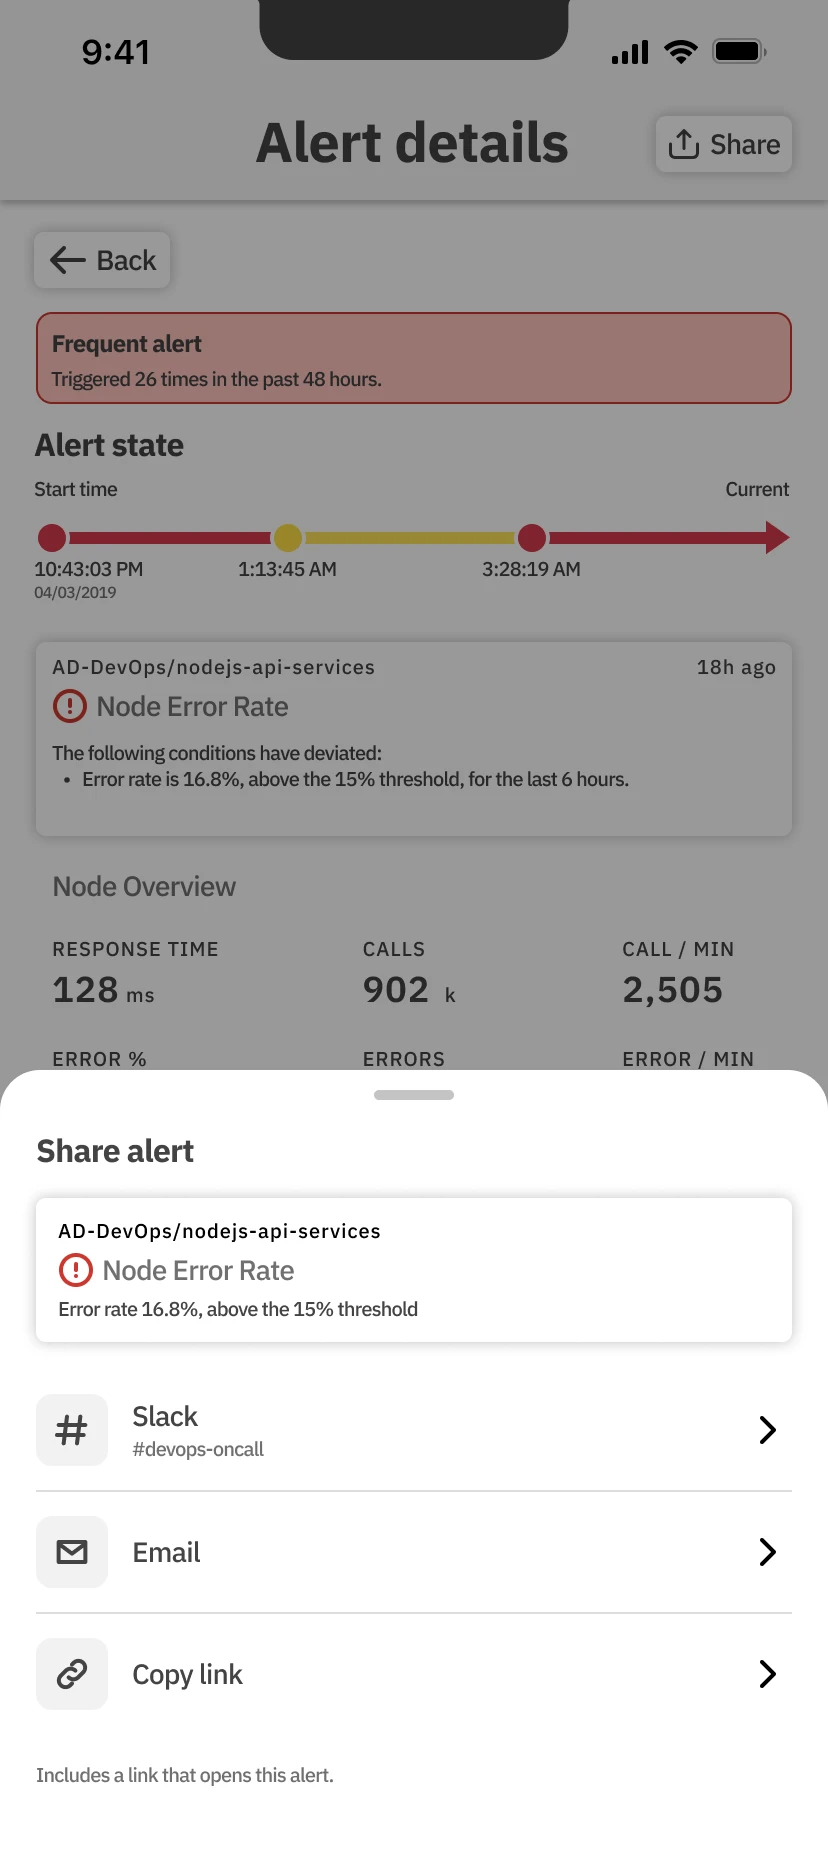
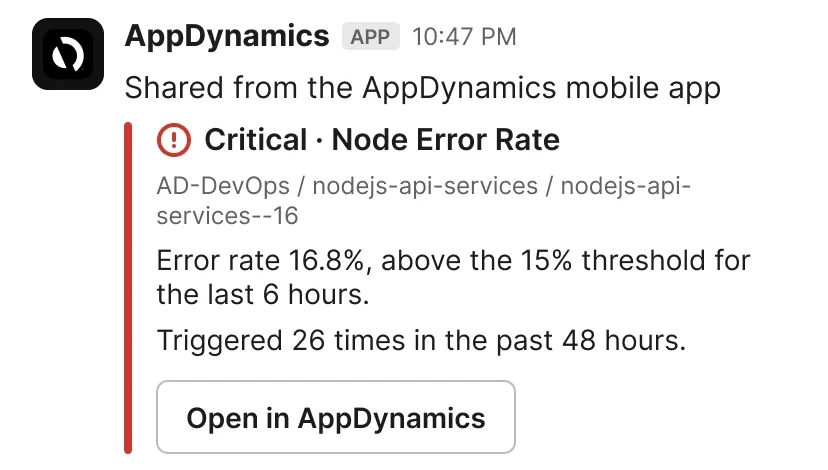
Share sends the alert to Slack or email with the condition, the count and a link back.
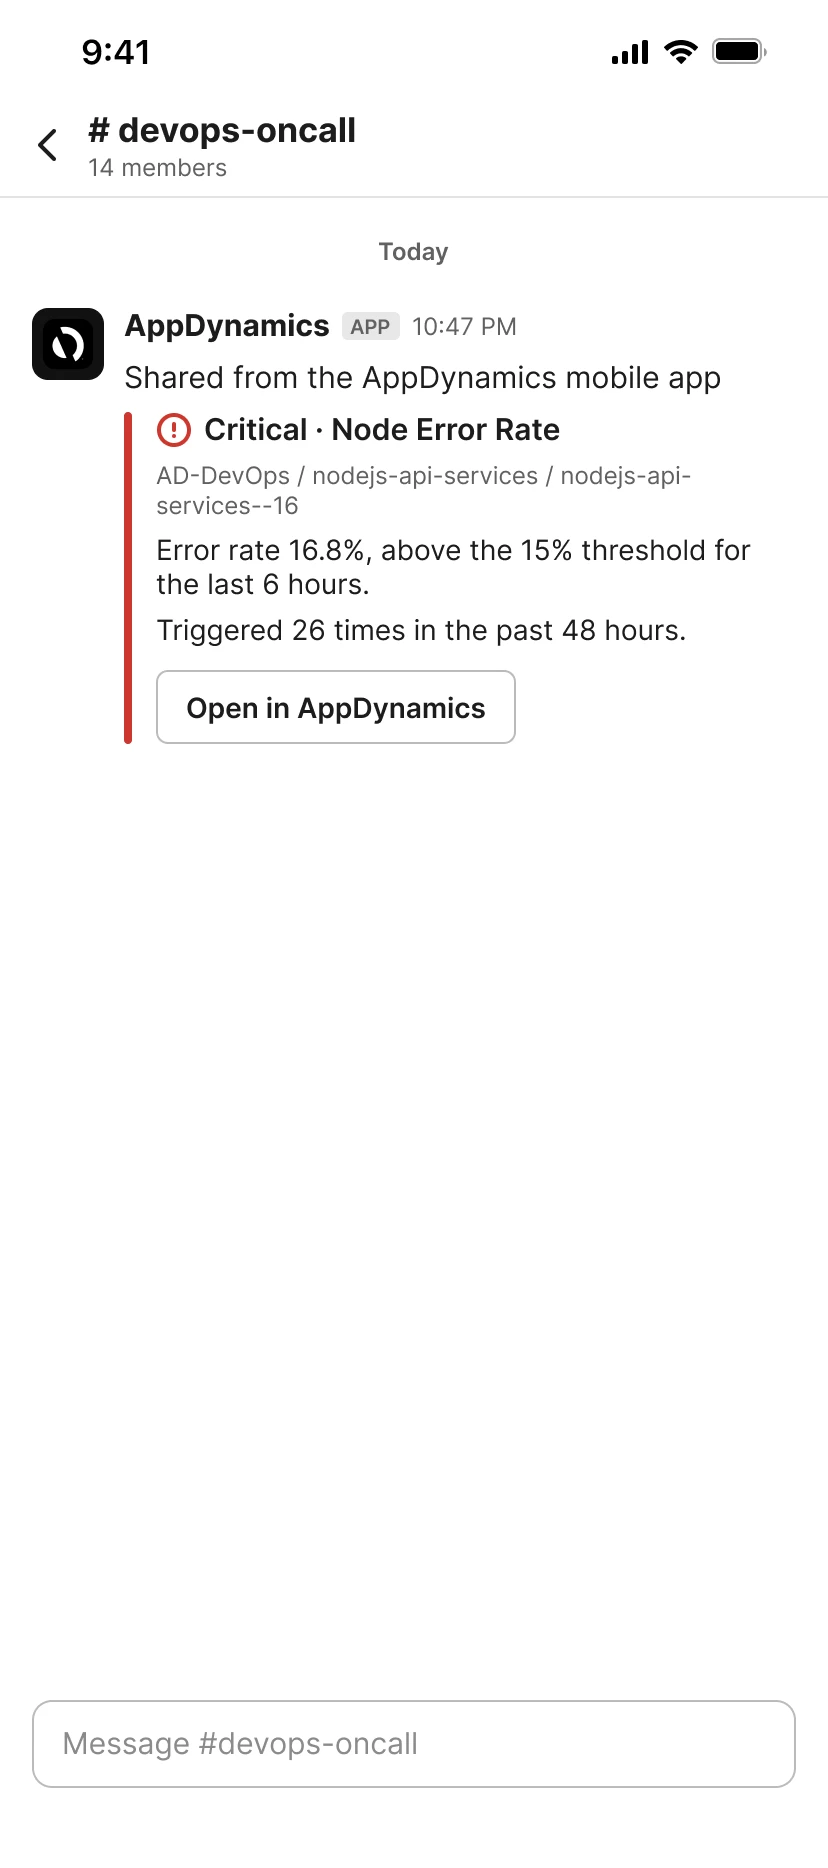
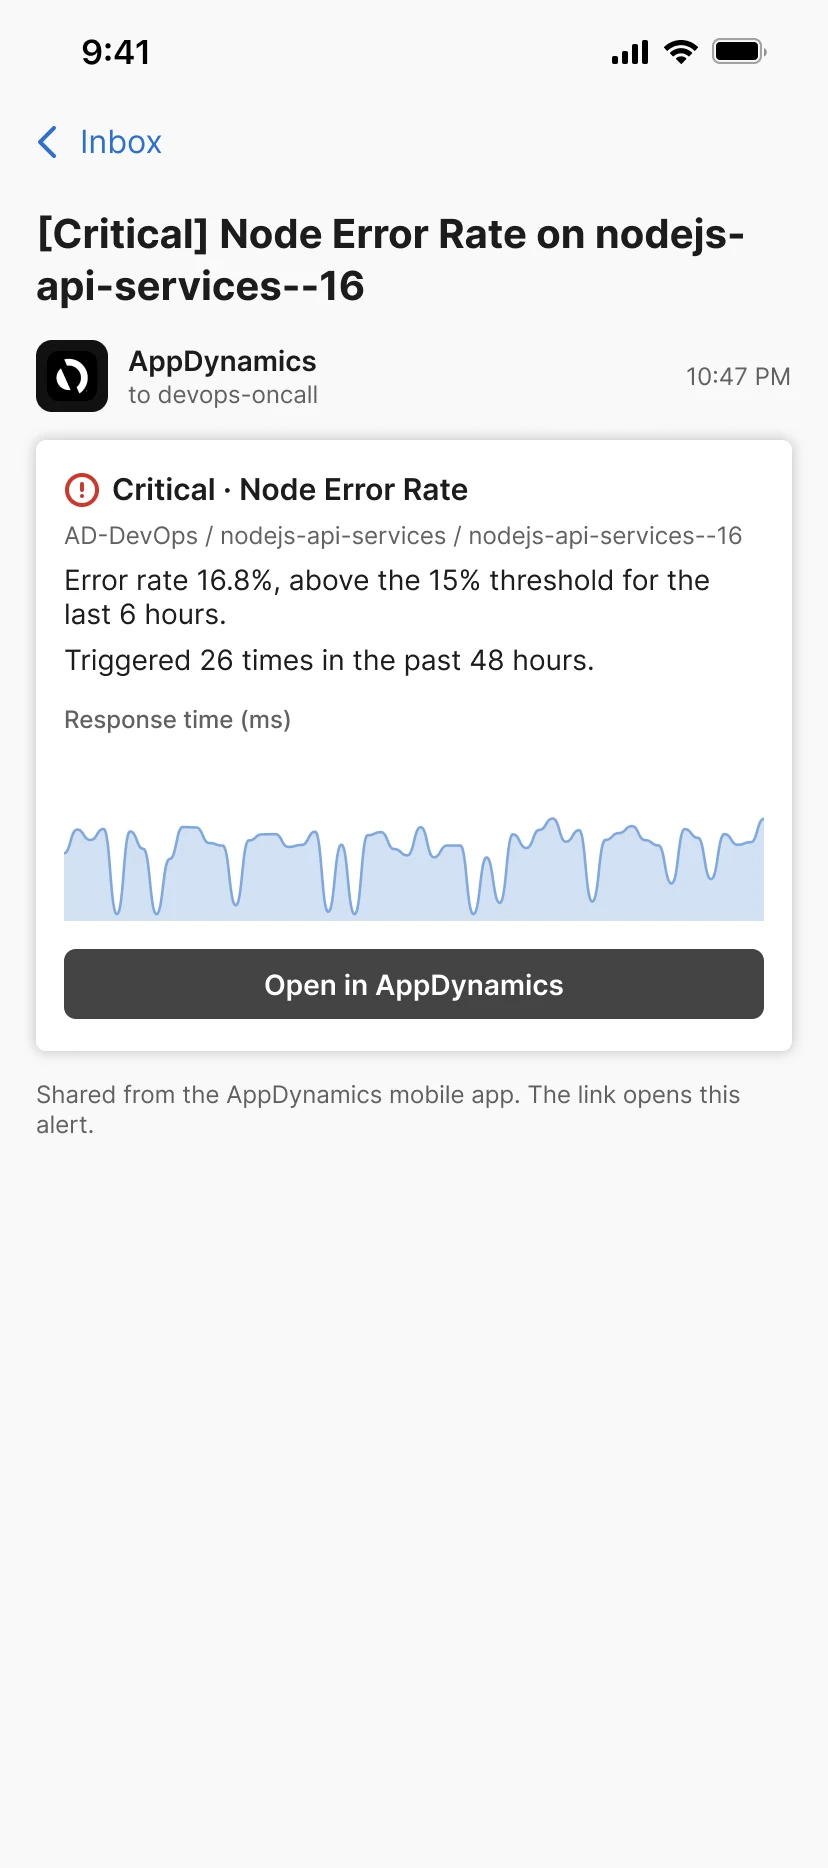
The person who got up should not have to retype the numbers into the channel the team already works in.
10 · Result
The notification says whether to get up.
Before, a push said something was wrong. After, it says the error rate is 16.8% against a 15% threshold, and that it has already fired 26 times. Twelve interviews asked for that answer, and a three-way test picked the number over a chart and over end-user impact. It shipped inside the rebuilt AppDynamics mobile app.
Putting the answer in the notification is a habit I've kept since: the Checks Wiki calculator also answers in one sentence at the top, with the working below.
- Which rule, how severe. The application, the rule and its severity in the title.
- The value, the threshold and the count. Enough to decide from the lock screen.